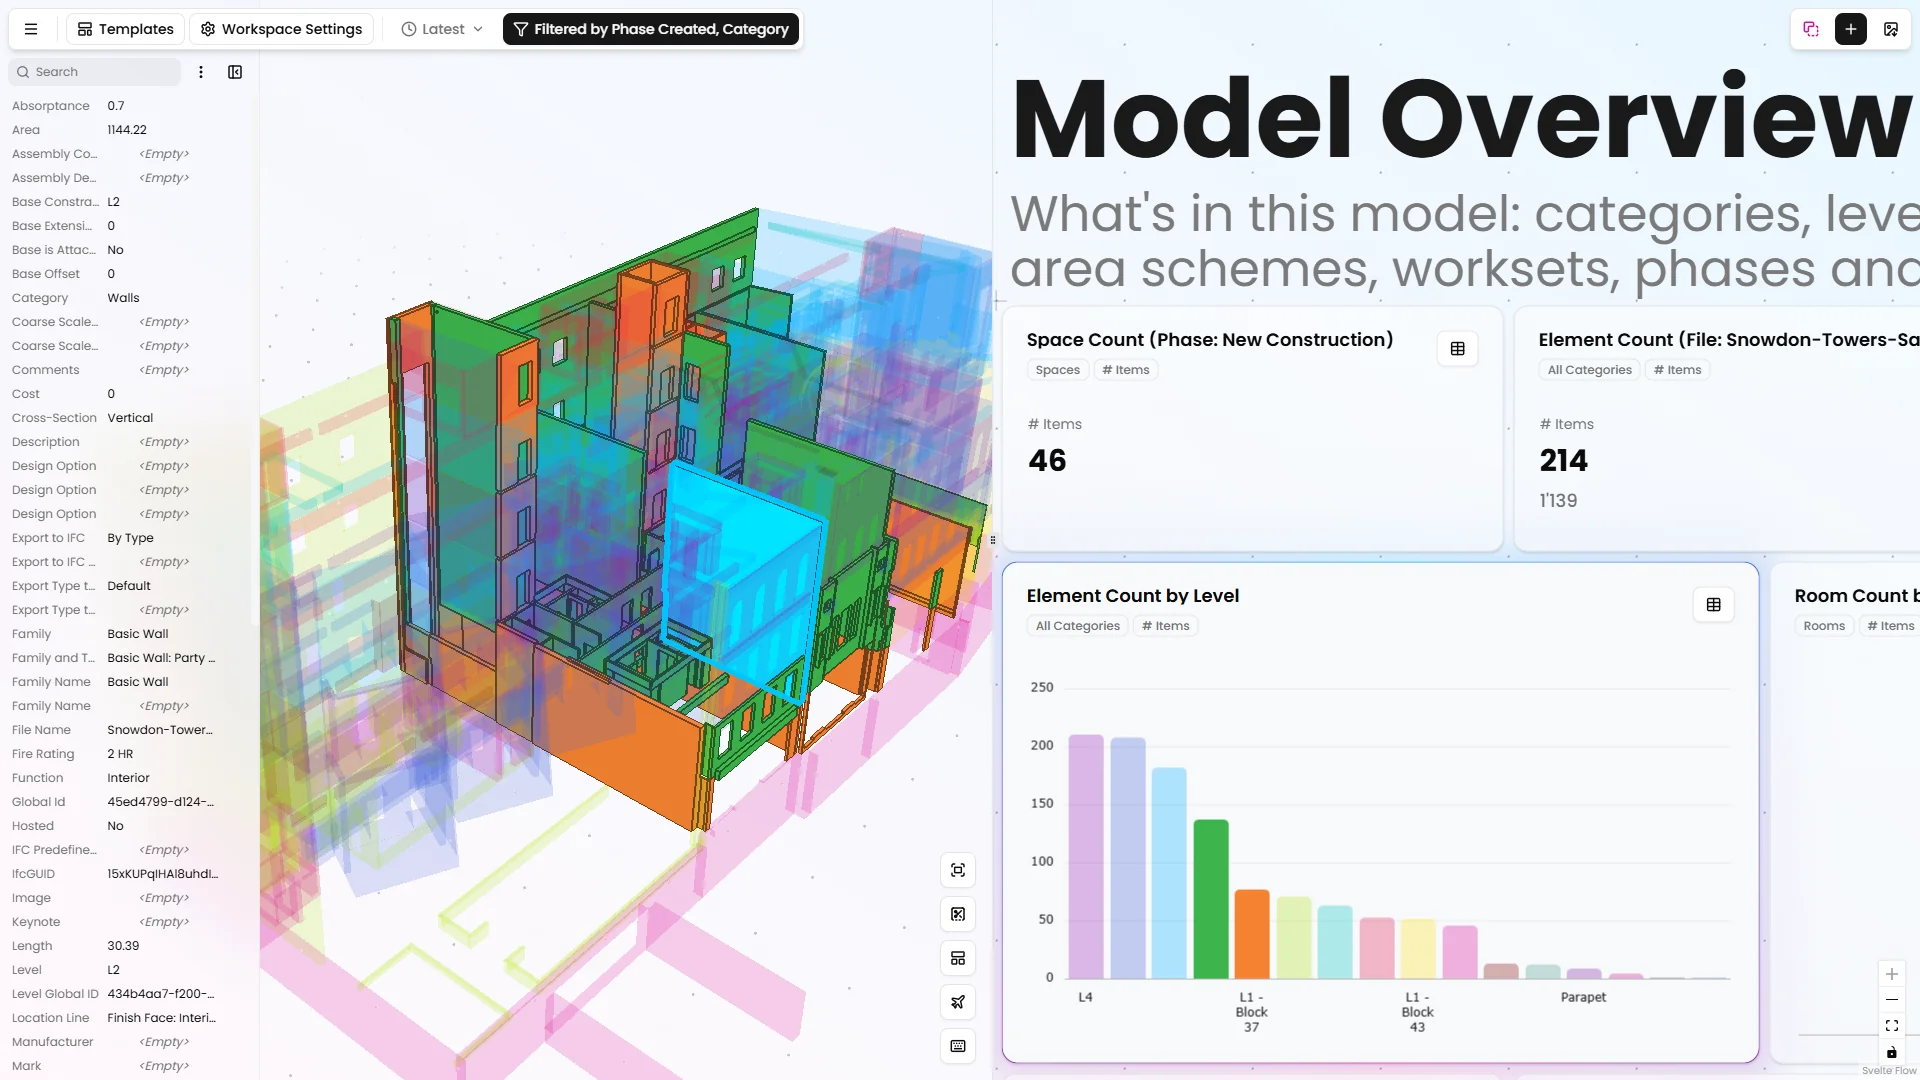
Every design decision raises questions. Does this meet the project requirements? What changes if we choose a different option? Where do we need to take a closer look? Finding those answers should leave you time to act on them.
This Vyssuals update starts with templates that help you find answers in the information already in your model. From there, new right-click actions help you explore a report or build the boards you need to check and manage your model.
Templates that adapt to your model
Every firm has its own standards, and every project has different requirements—shaped by the building, the client and the way the team works. The same information can end up in different parameters from one model to the next.
We have improved existing templates and added new ones. Intelligent parameter selection helps templates find the relevant information in your model.
For example, a room analysis can identify your project’s parameters for room use, department or area classifications, helping you explore how space is divided between usable areas, circulation and building services.
You spend less time searching for parameters. The template does that work for you.
Take the next step directly from what you see
Get quick insights from a report
When you are reviewing a report, one result often raises another question. What does this look like on one level? What remains if we leave out this category?
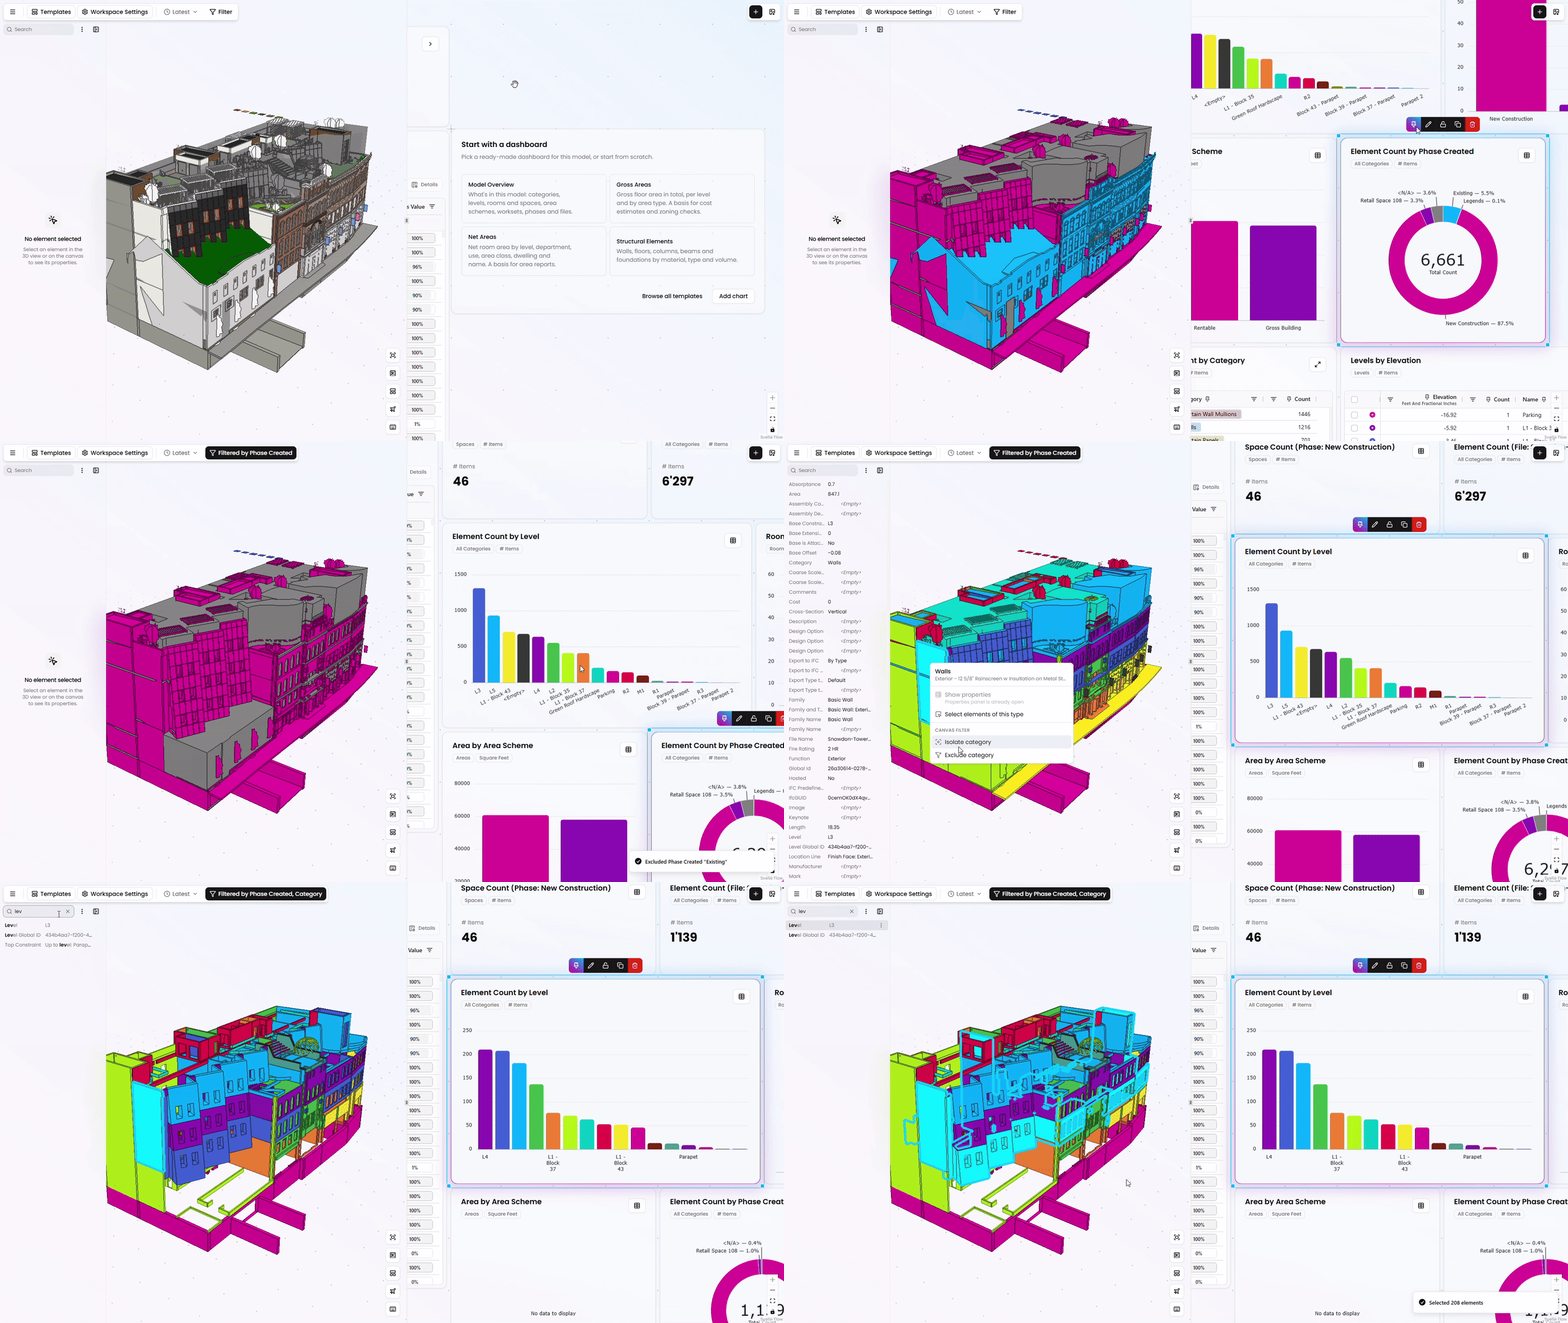
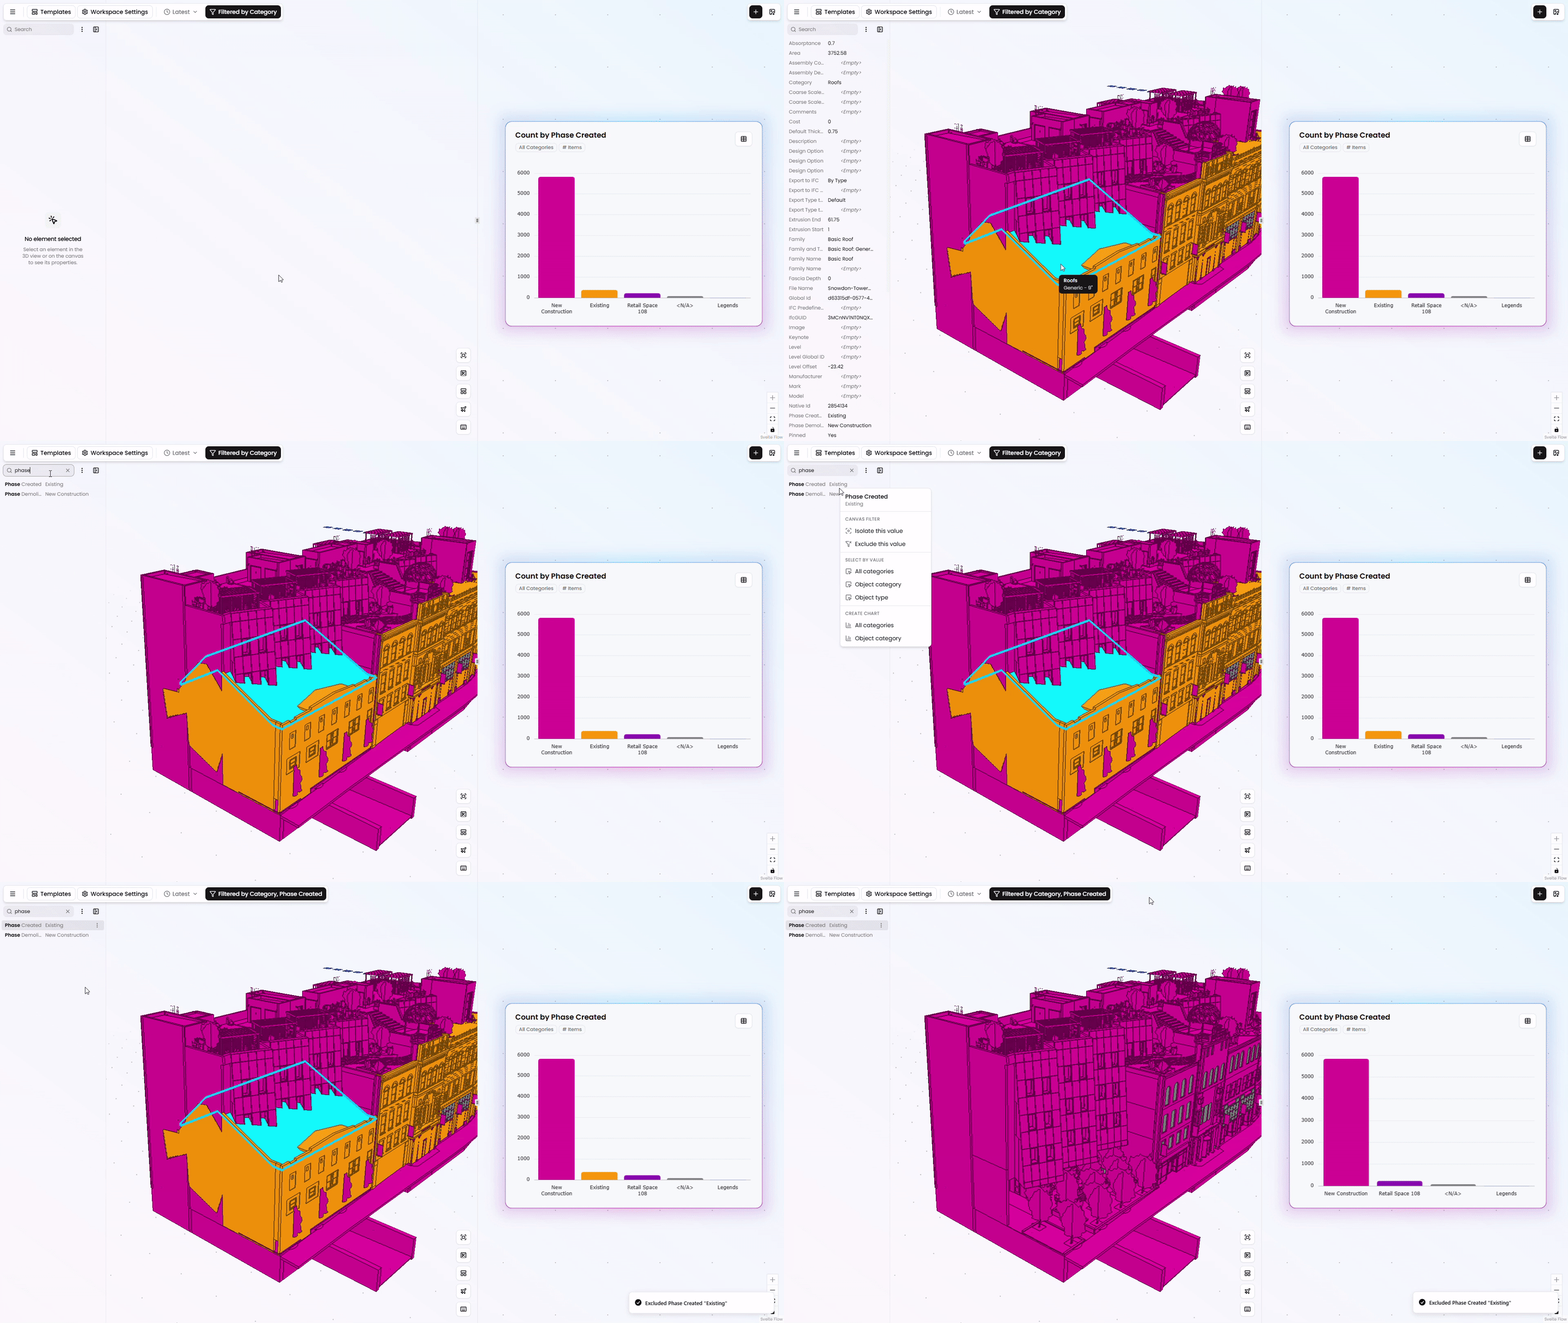
Right-click a bar, donut slice or value in the properties panel to include, exclude or isolate values in the report.
You can follow the question as it comes up, without having to build a chart or work through filter settings. Focus on the part that matters, compare the results and get back to the design decision.
Build boards and find the elements that need attention
For BIM teams creating boards and checking models, those menus offer another level of control.
Right-click a property to create a chart using that parameter, or select elements with a matching value across the model, within a category or within a type. Right-click actions on charts also let you select the elements behind a result.
That gives you a direct route from something you notice to a useful board or a set of elements to investigate. Build a breakdown from a property you are inspecting, find related elements and prepare the selection you need for model checks and corrections.
Additional improvements for everyday work
A few other additions make charts and filters easier to work with:
- Adjust charts more easily. Clearer sections and field layouts in the chart editor make settings easier to find and change.
- Find and select what you need. We have improved the parameter, operator and value selection dialogs to make it easier to find the option you are looking for.
- See what a chart includes. Removable filter chips beneath the title show its scope and let you remove a condition directly.
- Read proportions directly. Donut charts show slice percentages, and ratio charts can display percentages instead of decimals.
- Spot values that need attention. Conditional text colors on total and ratio charts highlight values against thresholds or ranges you set.
- Keep your board in place. Lock charts and text to preserve the layout as you work.
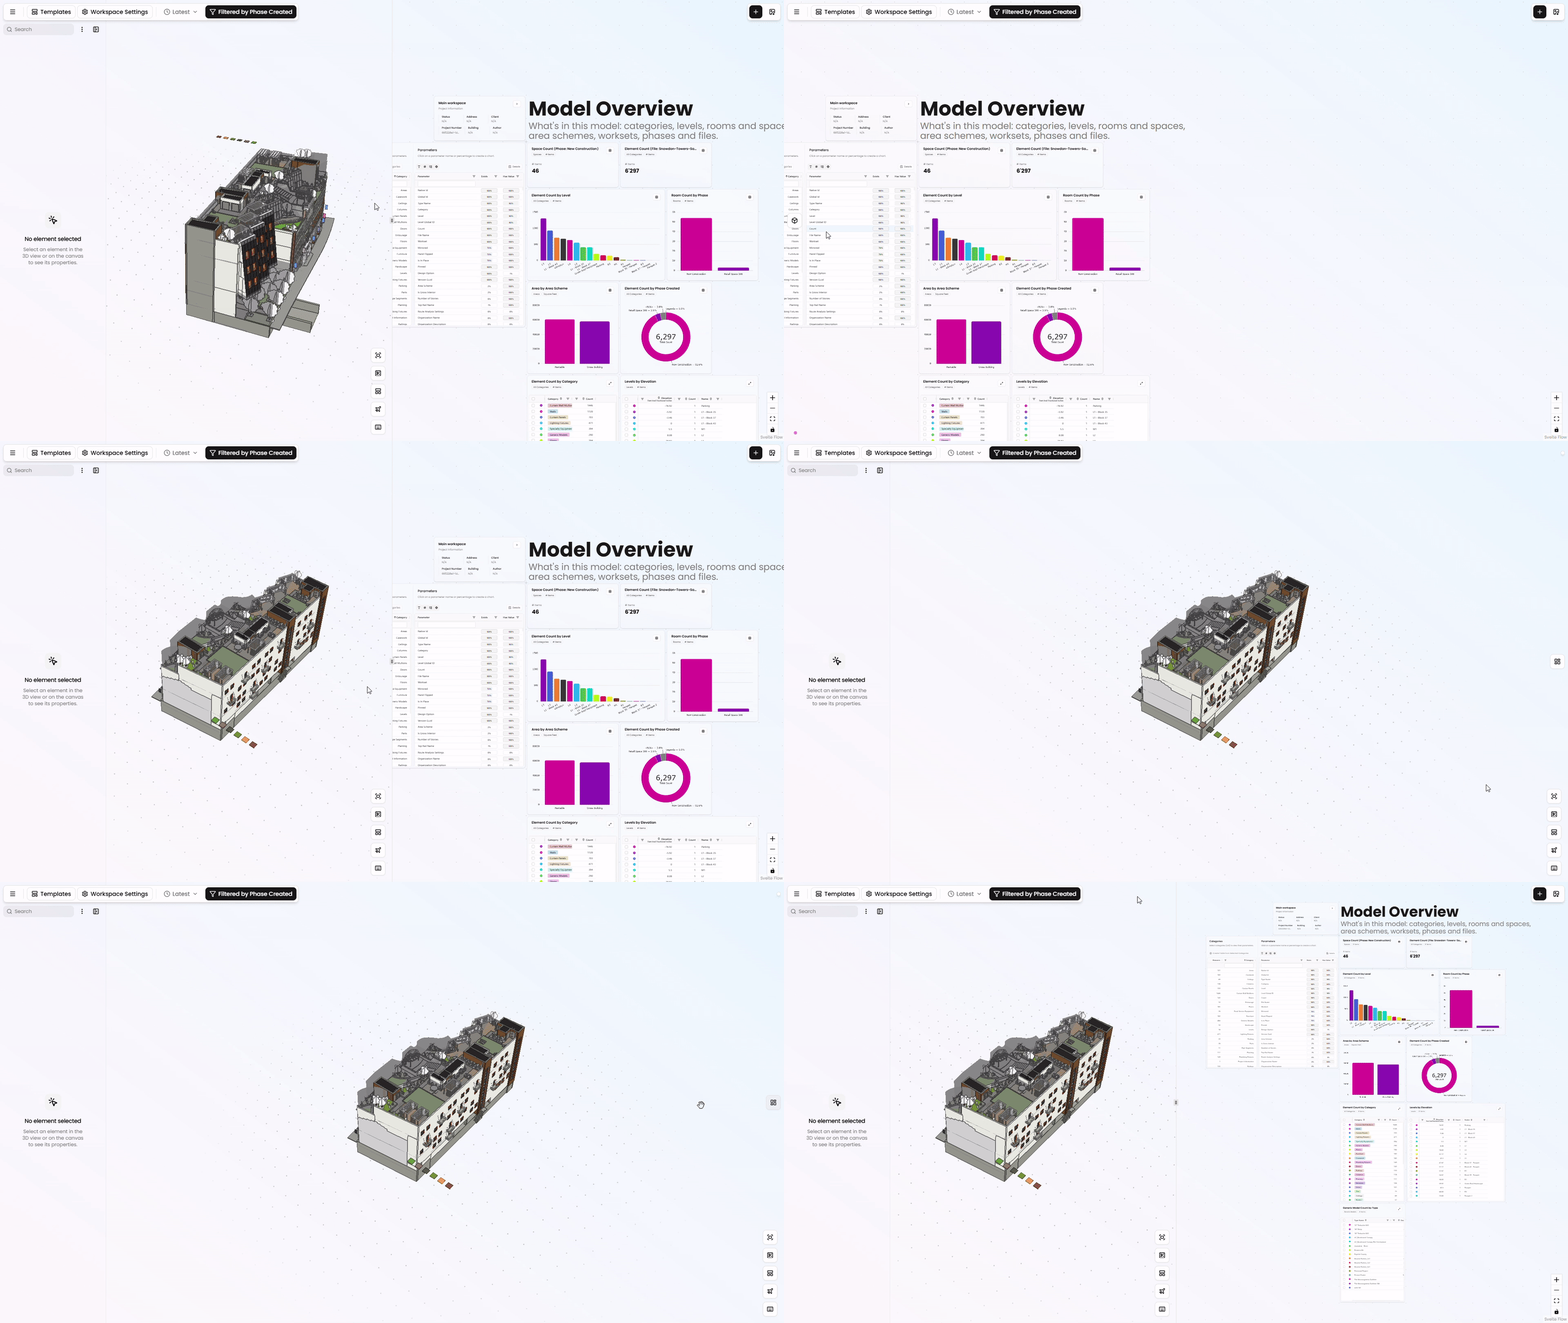
- Focus on the model or the canvas. Drag the line between the two views all the way to either side to hide the built-in 3D viewer or the canvas. Use the buttons at the side of the screen to bring the hidden view back.
Put the update to work on a real question
Choose a question from your current project: missing information, a quantity breakdown or a group of elements that needs a closer look.
With this update, you can start from a relevant dashboard, narrow the results directly from charts and properties, and inspect the affected elements in 3D. That is the work this release aims to make easier.