Since our last major release, we've been working hard to make Vyssuals even more intuitive and powerful. This update brings significant improvements that solve real problems you face every day when working with Revit data.
What's New: Solving Your Daily Workflow Challenges
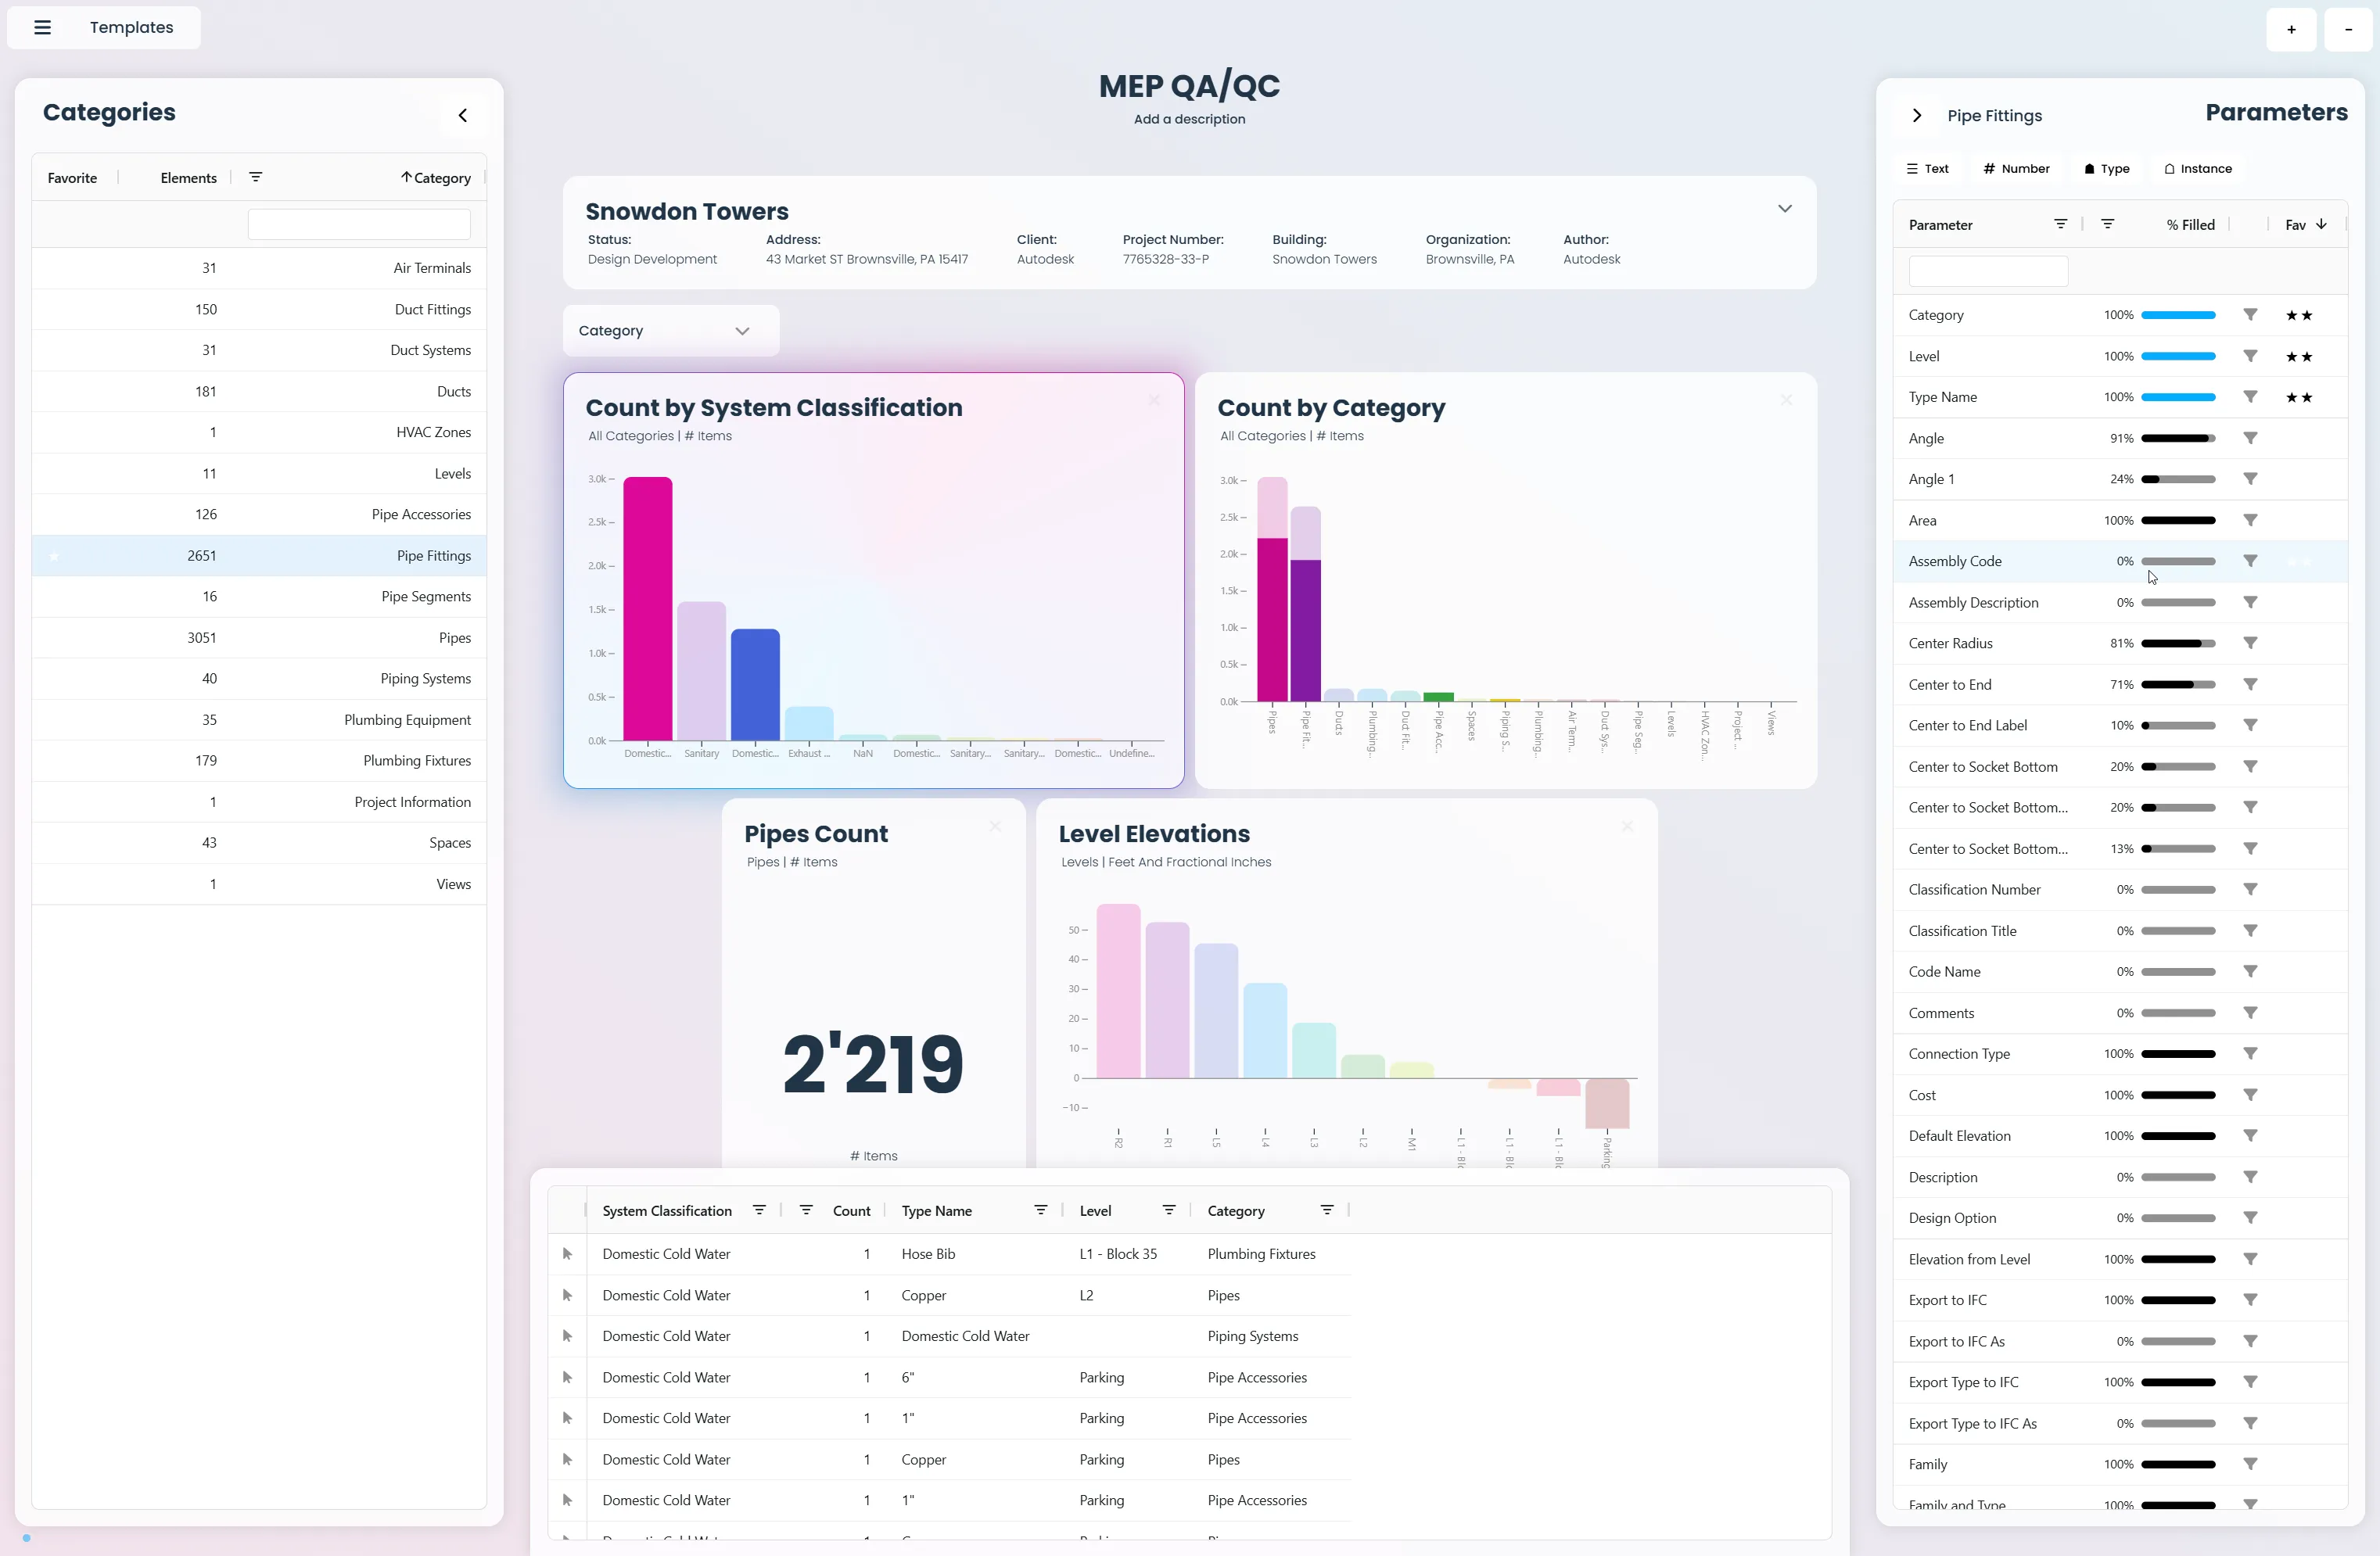
Categories Side Panel: Start Where BIM Data Begins
BIM data is inherently hierarchical - elements are first described by category (walls, doors, ducts, pipes, columns, beams, etc.), then by their parameters. For us, it's important to reflect this natural structure, making it easier to navigate your model efficiently.
The new Categories Side Panel gives you a quick overview of all categories in your model and how many elements each contains. Click on any category to instantly see:
- All parameters for elements in that category
- The fill state of each parameter (showing completion percentage)
- A full schedule view in the context table
Now you can navigate your model the way it's actually structured, and get to the information your looking for much faster
Parameters Side Panel: See What Matters at a Glance
Our clients needed to quickly assess parameter completeness across your model. Questions like "Do all walls have a fire rating assigned?" or "Which duct has no system assignment" traditionally require manual investigation.
The Parameters Side Panel serves two critical purposes:
- Parameter Overview: See all parameters for a selected category with their fill state percentage
- Instant Chart Creation: Create charts with a single click on any parameter
Now you can identify data gaps instantly and create visualizations without interrupting your workflow.
Chart Creation: From Parameter to Insight in One Click
Vyssuals has already removed any kind of export or complex setup for BIM data analytics to the point where creating a chart with just 3 or 4 clicks has become the most 'time-consuming part'. What remained was the question: what goes on the x-axis and what goes on the y-axis? I remember when I opened PowerBI for the first time - I couldn't answer that question.
So in short: The new chart creation can read your mind ;)
We have realized over the last couple of months that 90% of the charts users want to see are very predictable. It pretty much just comes down to one question: Is it a text or number parameter?
- Text Parameters: Usually need element counts grouped by the parameter you selected
- Number Parameters: Usually need aggregation by element type
The new one-click chart creation automatically chooses the right chart type. Plus, hover over any parameter to see a preview of what the chart will look like before you create it.
Now you can go from question to answer in seconds, not minutes. Focus on what the data tells you, not how to display it.
Context Table: See the Full Picture
With any chart, you often need to see the underlying data to understand what's happening. But switching between views breaks your workflow and makes it hard to spot patterns.
The new Context Table provides instant, interactive access to your data:
- Drill-Down Capability: Click on any chart element to see detailed information about the Revit elements that make up the chart.
- Interactive Exploration: Always shows you relevant information about what you are currently focussed on
- Revit Selection: Select one or many elements in revit with just a single click on a row in the table.
- Category Schedule: With a single click on a category you instantly get a full list of all its elements with columns for your favourite parameters. How long did it take again to make a simple schedule in Revit...?
Context is key. Make better informed decisions and spot issues faster.
Improved Filters Across the (Dash)board
Pun intended.
Traditional filtering in Revit is limited and often requires multiple steps to get the data you need. You waste time clicking through menus and still don't get the results you're looking for.
We've completely rebuilt our filtering system with intelligent search and cross-filtering capabilities:
- Cross-Filtering: Clicking on a bar in one chart will highlights parts of bars on other charts - just like you are used to from other BI tools, but faster.
- Dashboard Filters: Inspired by online stores (the masters of filtering large datasets), these filters help you quickly narrow down the entire dashboard to what you're actually interested in
- OR/AND Logic: Combine multiple criteria exactly how you need them
- Fuzzy Search: Type what you're looking for and get instant results, even with typos or partial matches
More precise and less precise at the same time - but always what you need.
How These Changes Make You More Effective
Faster Data Exploration
The new workflow respects the natural hierarchy of BIM data. Instead of fighting against the software's structure, you can now explore your model the way it's actually organized - by category, then by parameter. This means you spend less time hunting through menus and more time understanding what your data is telling you.
Instant Chart Creation
The one-click chart creation eliminates the most time-consuming part of data analysis - setup. What used to require multiple decisions about chart types, aggregations, and configurations now happens automatically. You can focus on what the data tells you, not how to display it.
Better Context and Understanding
The Context Table transforms how you interact with your data. You can drill down into any chart element, see the underlying Revit elements, and even select them directly. This creates a seamless flow from visualization to action.
Smarter Filtering and Navigation
The improved filtering system works the way you think. Fuzzy search handles typos and partial matches, cross-filtering shows relationships between different data views, and the canvas filters help you quickly narrow down to what you're actually interested in - like shopping online... No wait. That's not a good comparision 😄 - but since your've read this far, you're smart, you get the point!
What This Means for Your Workflow
Remember when we described Vyssuals as "the Enscape for data"? These updates make that even more true. Just as Enscape revolutionized how you see your 3D designs, these features revolutionize how you see your data.
You're no longer just visualizing information - you're actively exploring it, questioning it, and using it to make better design decisions. The tool becomes an extension of your thinking process, helping you spot opportunities and problems you might otherwise miss.
Looking Ahead
This update represents a significant step forward in making Vyssuals the most intuitive and powerful data tool for AEC professionals. But we're not stopping here. We're already working on the next set of features that will make your data work even harder for you.
The goal remains the same: transform how you think about BIM data from something you extract after the fact into an integral part of your design process.
Ready to experience the difference? These updates are available now, and they're designed to work seamlessly with your existing workflows. Start exploring your data in new ways, and discover insights that will make your designs better than ever.