This release is big enough that it deserves the 1.0 label.
Until now, Vyssuals was primarily about seeing your Revit data better – faster dashboards, smarter filtering, infinite canvas. With 1.0, Vyssuals becomes a place where you can edit, transform and automate your data directly from the dashboard, with full control over what actually gets pushed back into Revit.
Below is a guided tour of what’s new:
A Smarter Parameters Table
The parameters view has grown up from a simple list into a data analysis tool in its own right.
Details panel for every parameter
Click the new Details button to see:- How many categories the parameter exists on
- How many native Revit parameters it represents under the hood
- How many distinct values it has across your current selection
- The data type that Vyssuals uses internally
Native Revit parameter mapping
Vyssuals merges parameters by name wherever it makes sense, but still respects hard boundaries:- Type vs instance parameters are treated separately
- Parameters with different data types are never forced together
- Built-in parameters like all the different “Level” variants are shown explicitly, so you can see what is being merged into your unified “Level” parameter.
You can always drill into Native Params to see the real Revit parameters (including things like schedule-level IDs and structural variants) that contribute to the Vyssuals parameter.
Awareness of “Varies Across Groups”
The Details dialog surfaces whether a parameter can vary across groups – crucial if you plan to do mass-editing from the dashboard. If you’ve ever seen Revit complain that “elements in groups cannot be changed from outside the group”, this is where you catch and fix those problems before you start.
Direct Editing in Tables – With Git-Like Change Previews
The element tables are no longer just for inspection – you can now edit values directly and see a git-style diff before anything is applied.
Inline editing
Turn on the table view, double-click into a cell, change the value and hit Enter. The change doesn’t go straight into Revit – instead, it becomes a proposed change.Per-row and bulk approval workflow
Every proposed change can be:- Approved
- Rejected
- Cleared
You can filter the table to only show approved, rejected, or pending changes, and you can bulk-approve or bulk-reject when you’re confident about a set of edits.
Git-like previews everywhere
For each cell, you see:- Old value in red
- New value in orange
This looks a bit “overkill” when you edit a single cell, but becomes incredibly powerful once you start stacking transformations or working on dozens/hundreds of elements at once.
Only approved changes are ever pushed
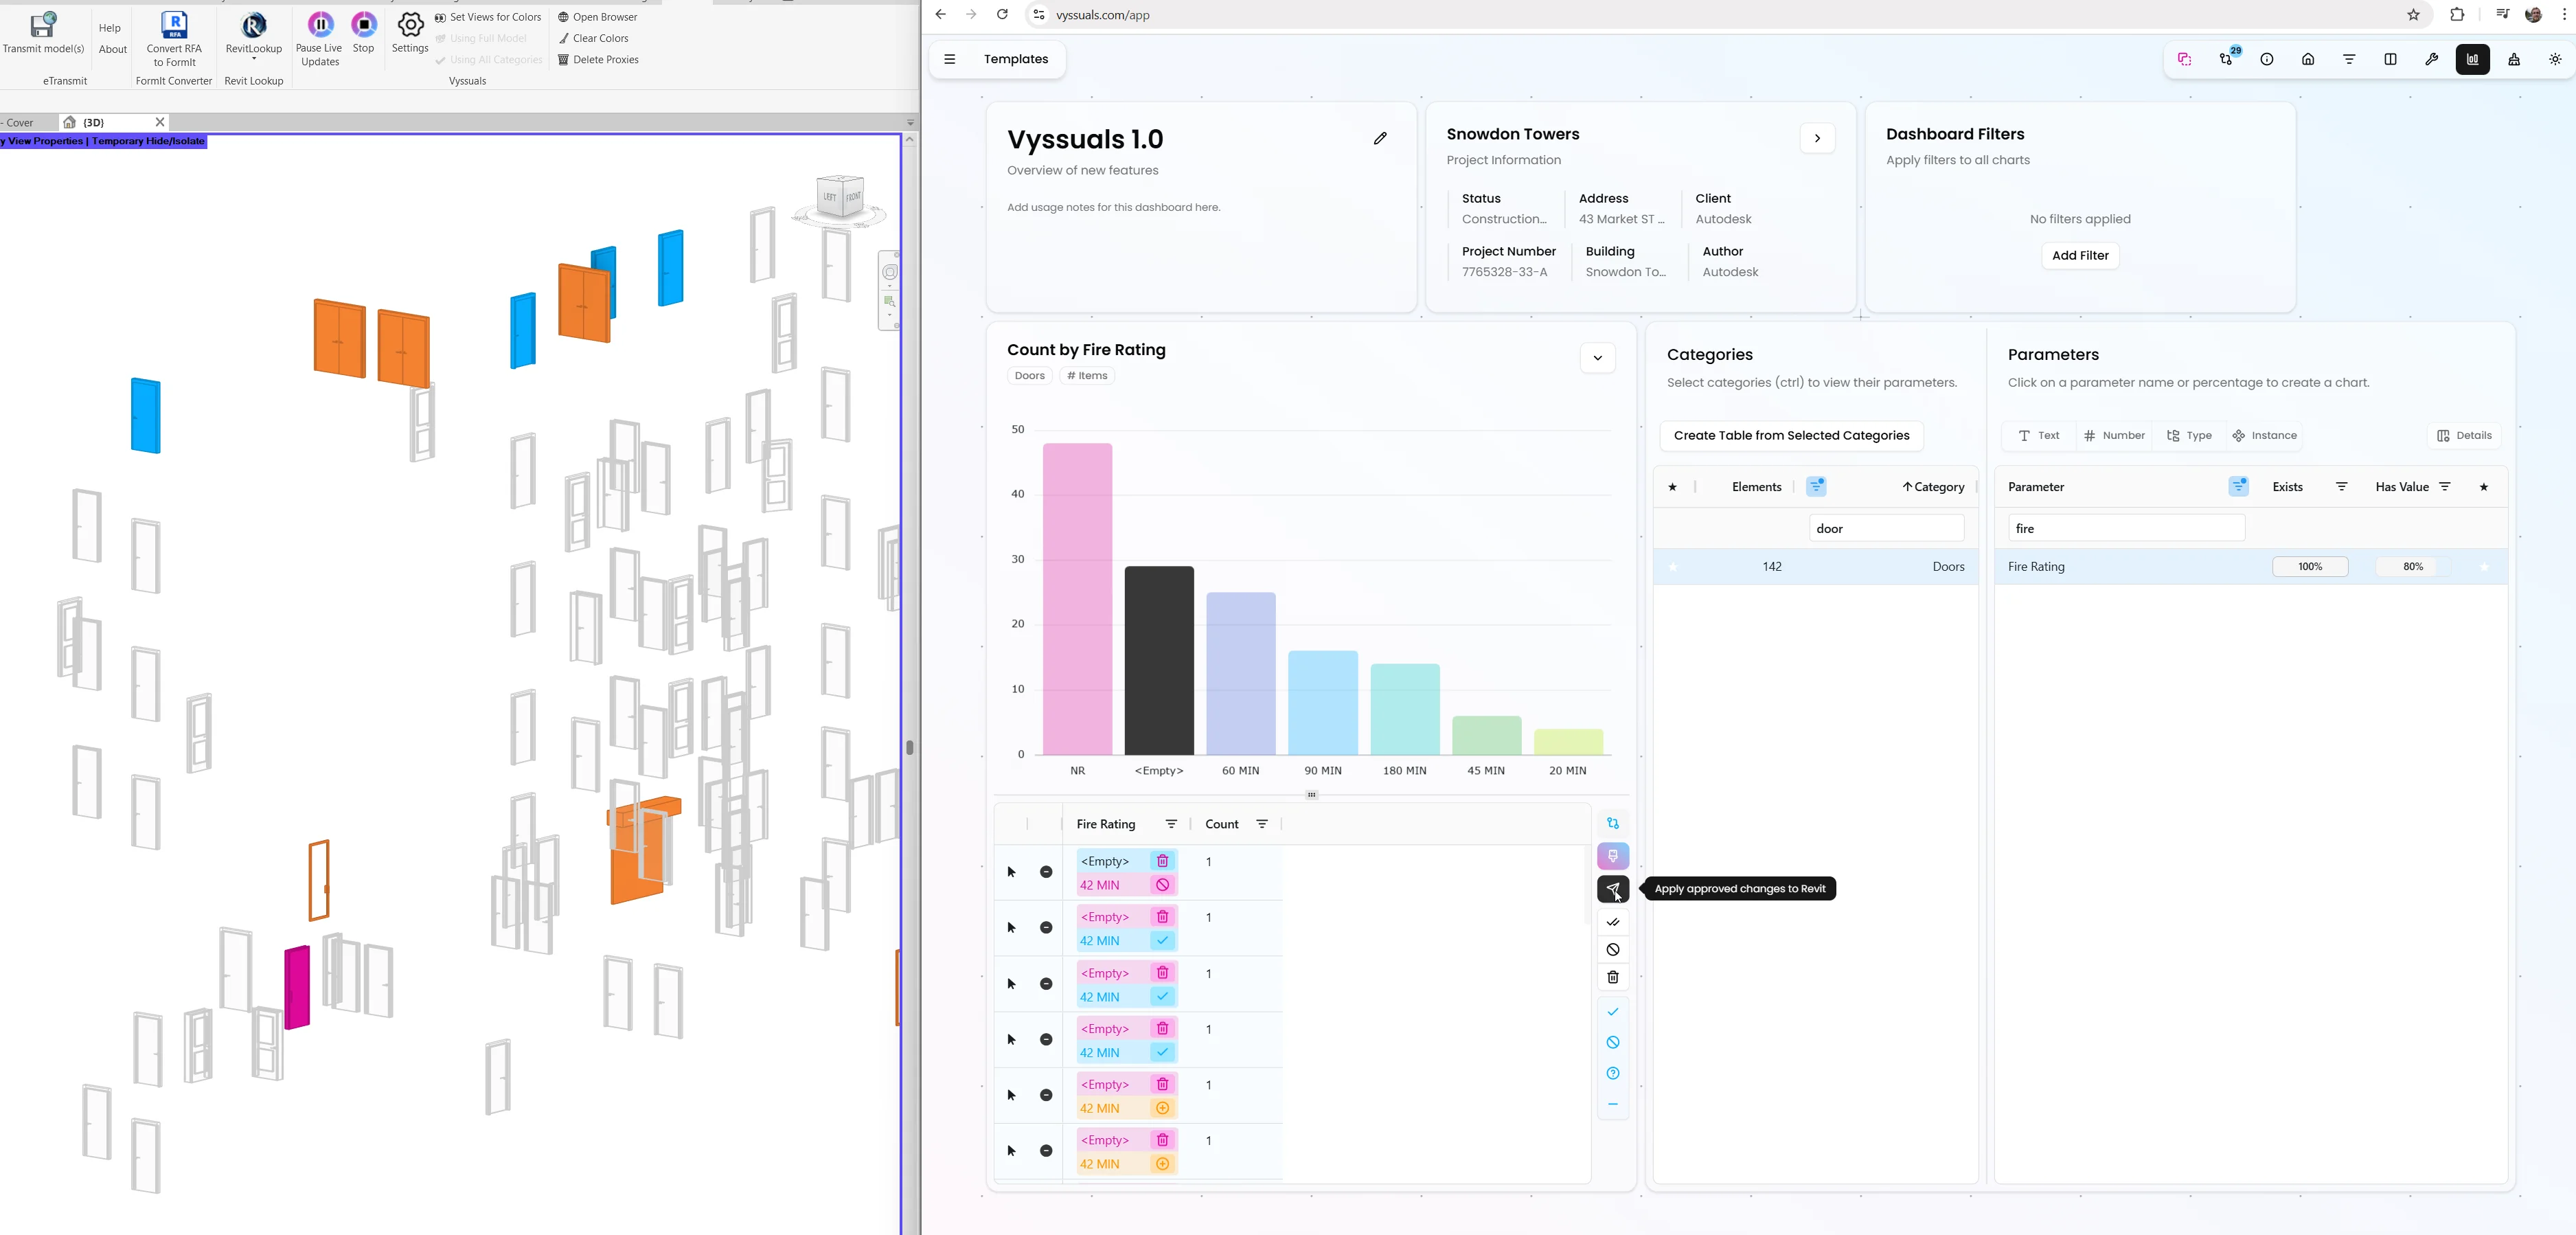
The little paper-plane icon sends changes to Revit – but only those that are approved. Rejected or untouched proposals are safely ignored.
Visual Change Previews in the 3D Model
Editing directly from the dashboard is great, but you still need to see what’s going on in the model.
Diff-based coloring in Revit
You can color the model based on a chosen parameter column:- Gray – elements without any pending change
- Orange – elements with a new (pending) change
- Other colors – once approved or rejected changes are pushed, you can re-color to validate what actually got changed
Filter-aware previews
Because everything builds on the existing dashboard filtering, you can:- Restrict edits to a subset of elements (e.g. doors on Level 3)
- Preview only the affected elements in 3D
- Push changes knowing exactly which part of the model you’re touching
This combination of tabular diff + spatial feedback makes it much easier to trust what you're doing before committing changes to the model.
Automated Rule Fixes: One-Click Compliance
Rules in Vyssuals help you identify problems – but what if you could fix them with a single click?
The new Fix button on rule charts automates the generation of proposed parameter changes to fix rule violations. Instead of manually identifying and correcting each failing element, you can click one button to generate all necessary changes at once.
How It Works
When you click Fix on a rule chart:
- Validates the rule – Ensures the rule can generate automated fixes (requires 'AND' combination and supported operators)
- Queries failing elements – Finds all elements that violate the rule
- Generates proposed changes – Creates parameter value changes (diffs) for each failing element to make them compliant
Key Benefits
- Time savings – Generate fixes for hundreds or thousands of elements in seconds, eliminating manual identification and correction
- Accuracy – All elements are fixed according to the same rule logic, ensuring consistency and no missed elements
- Full workflow integration – Generated changes appear as diffs that go through the same review and approval process as manual edits
Supported Rules
The Fix button works with:
- Single rules (any combination type)
- Multiple rules with AND combination
- Rules using operators:
equals,startsWith,endsWith,notContains,notStartsWith,notEndsWith
Essentially the rule has to be 'unambiguous' meaning it has only one possible correct scenario.
Use Cases
Standardization projects: Create a rule that checks for the desired naming pattern, click Fix to generate all necessary changes, review in a table chart, and apply to Revit.
Quality assurance: When you discover a compliance issue, the rule chart already shows what's failing – click Fix to generate all fixes automatically, review, and approve.
Bulk corrections: A design change requires updating a parameter value across many elements? Create a rule that identifies elements needing the update, click Fix, and review in bulk.
Like all editing features in 1.0, Fix-generated changes are proposed, not applied automatically – you maintain full control through the diff and approval workflow before anything goes back to Revit.
New Tools Menu: Text Transformer, Splitter, Combiner and Formula Calculator
The new tools menu turns your dashboard into a kind of no-code scripting environment – but with the same diff/approval safety net as manual edits.
Each tool follows the same layout:
- Select categories and optional filters
- Choose the input and/or output parameters
- Configure the tool-specific settings
- Generate changes → review → approve → push to Revit
1. Text Transformer
The Text Transformer lets you bulk-edit text parameters with a full preview of every change:
Modes available:
- Find and replace
- Add prefix
- Add suffix
- Change casing (upper/lower)
- Remove characters (by position/range)
- Insert characters (at a given index)
- Revalue (inspired by PyRevit’s revalue)
Layered transformations
You can:- Run multiple operations on the same set of elements
- Lock in certain changes by approving them (they will no be affected by any further transformation)
- Run additional transformers that only affect the remaining pending ones
This makes it easy to build step-by-step clean-up pipelines directly in the UI: rename, standardize prefixes, patch exceptions – all with full visibility and control.
2. Parameter Splitter
The Parameter Splitter takes a single input parameter and distributes parts of it into two or more output parameters, based on a pattern.
Typical use cases:
- Splitting a “composite” room code into:
- A human-readable part
- A technical or grouping part
- Breaking apart type names into multiple parameters for more flexible scheduling
You define a pattern (e.g. before separator goes into Parameter 1, after separator into Parameter 2), and Vyssuals:
- Removes the separator
- Routes the two sides into the target parameters
- Shows you all proposed changes before you push them to Revit
Tip: You can also use Splitter/Combiner as a “move value” tool by copying everything from one parameter into another.
3. Parameter Combiner
The Parameter Combiner does the reverse: it takes multiple input parameters and builds a new text value in a target parameter.
You can:
- Combine multiple properties into a single identifier (e.g. level + type + workset)
- Inject literal text, separators or formatting characters into the pattern
- Use it to generate readable, structured codes straight from existing model data
Again, everything goes through the familiar change preview + approval workflow before being pushed back into the model – so you can experiment safely and manually adjust if needed.
4. Formula Calculator (with Text Support)
Revit formulas are powerful but limited – especially when it comes to text parameters.
The new Formula Calculator in Vyssuals:
- Lets you use multiple input parameters (text or numbers)
- Writes results into any chosen output parameter
- Uses a syntax that is very close to Revit’s own formulas, with one key addition:
- Parameters are referenced with curly braces:
{Level},{Height}, etc. - Text comparisons and outputs use quotes (double quotes for reliability)
- Parameters are referenced with curly braces:
Examples:
if({Level} = "L2", "is on level 2", "not on level 2")- Numeric operations like
{Height} + {Width} * 2
There are two modes:
- Calculate mode – run formulas per element, just like Revit formulas but with text support
- Aggregate mode – group elements (e.g. by Occupancy) and write aggregated values (like total area per group) back into each instance
Aggregate mode is especially useful for things like:
- Writing the total apartment area into every room of that apartment
- Summing up areas or counts by any grouping you define and reflecting that back into the model
Aggregate Mode: Group-Based Calculations Written Back to Elements
The Aggregate mode deserves its own highlight.
You can:
- Choose grouping fields (e.g. Occupancy, Apartment Number)
- Pick numeric input parameters (e.g. Area)
- Define aggregations like
sum({Area}) - Write the resulting total back into a text or number parameter on every element in that group
It’s a clean way to implement familiar “sum per group” workflows without writing Python scripts or Grashopper and Dynamo.
Tooltips and Guardrails Everywhere
Because 1.0 introduces a lot of power, the UI is full of tooltips that explain:
- What a given tool does
- How particular modes work
- What to be careful about (for example: pushing tens of thousands of changes into Revit will make Revit go cry in the corner and never come back.)
The overall philosophy remains:
- Experiment safely
- See every change before it happens
- Keep full control over what goes back into Revit
What Vyssuals 1.0 Means for Your Workflow
With 1.0, Vyssuals moves from being "just" a visualization and analysis layer into becoming an interactive editing environment for your Revit data:
- You can fix data issues where you see them – directly from the charts and tables that revealed the problem, or use the Fix button to automate rule compliance.
- You can build repeatable mini-scripts with the tools menu – without touching Dynamo, Grasshopper or custom code.
- You always have a clear diff and approval workflow between analysis and model changes.
Every building is a prototype of itself. Vyssuals 1.0 gives you the tools to iterate on that prototype faster – not just by looking at the data, but by changing it with confidence.
Want to see these features in action?
Watch the full Vyssuals 1.0 walkthrough on our YouTube channel, or log in to the app and start exploring your own models with the new editing tools.