I've been there. You're staring at a Revit model that looks perfect in 3D, but you know the data behind it is a mess. Your room program says you need 2,500 square meters, but you're not sure if you actually delivered it. That door schedule with 70 columns and 5,000 doors? You're praying it's accurate because manually checking it would take days. And those walls - you know some of them have the wrong base constraints, but finding them all feels impossible.
This is exactly why I built Vyssuals. It transforms your workflow from "hope it's right" to "know it's right."
The Data Dilemma I Lived Through
Every architect, engineer, and BIM coordinator faces the same challenge: data blindness. Your Revit model contains thousands of data points that could reveal design issues, optimization opportunities, and quality problems. But this information is buried in schedules, properties, and parameters that are hard to read, difficult to verify, impossible to visualize, and out of context.
I built Vyssuals to solve this exact problem. It gives you X-ray vision for your Revit model - you can see through the geometry to understand what's actually happening with your design data.
Use Cases by Profession
Architects: Room and Area Analysis
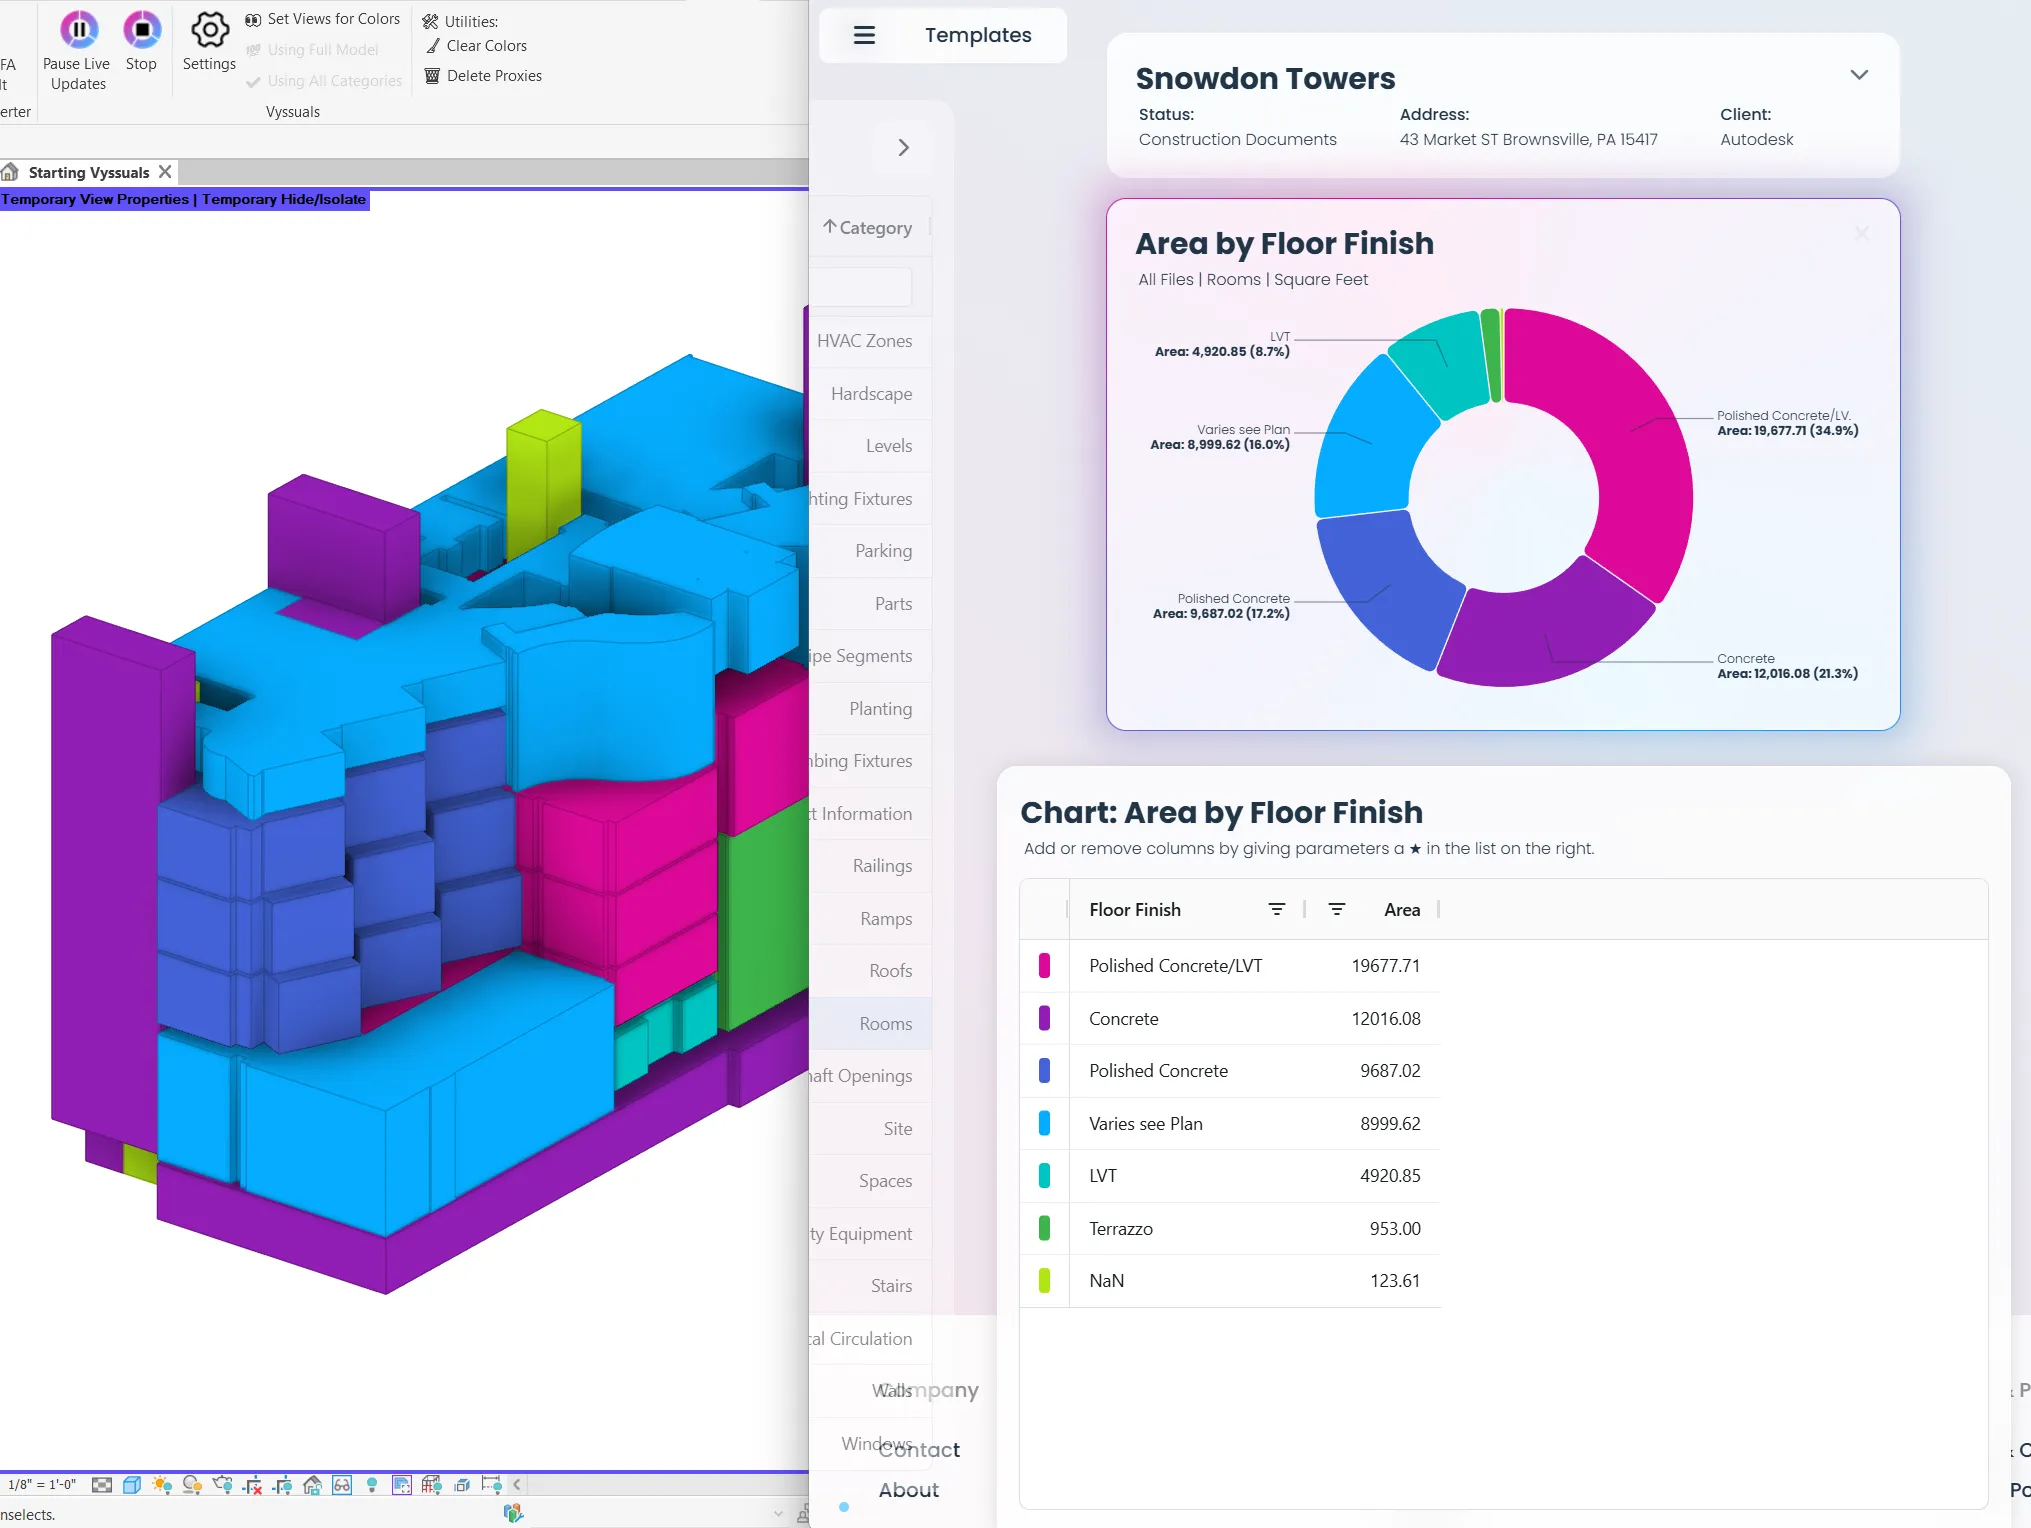
3D Room Visualization: Revit has a fundamental limitation - rooms don't appear in 3D views. Vyssuals solves this by creating 3D proxy objects that represent room volumes. These colored boxes show you exactly where your rooms are located, and you can click on them to select the underlying Revit room elements. Now you can verify room assignments in 3D space, check room-to-room relationships, validate spatial organization, and present room layouts to clients in 3D.
Every project starts with a room program - a list of spaces with specific area requirements. But how do you verify that your design actually delivers what the program demands? I was very good at using Revit schedules, and they can work - but only up to a certain point. One of the main issues is that while schedules reflect model elements, there's no visual connection between the schedule and the 3D model or plan view. You can see the numbers, but you can't see where the problems actually are in your design.
Vyssuals transforms this into instant insight. You can see your room distribution immediately, identify gaps, and validate program compliance in real-time. The workflow starts with program validation - create a "Room Area by Department" chart to see distribution, compare actual areas against program requirements, and spot departmenbts that are too small, too large, or missing entirely.
Some advanced use cases really show the power of Vyssuals. For example, you can use rule charts to check if all 'bedrooms' meet a minimum area requirement - crucial when doing social housing projects where you won't get authorities' approval if bedrooms are too small. Or take setback ratios: you can set up two total charts with filters to compare the gross floor area of the penthouse versus the floor below, then use a ratio chart to calculate the exact ratio and ensure your setback requirements are met.
Architects: Door Schedule Management
Every project has doors. Lots of them. And every door has dozens of parameters: fire rating, material, hardware, accessibility, acoustic performance, and more. I remember staring at door schedules with 70+ columns across hundreds of rows, trying to spot the one door that had the wrong opening direction. It was like finding a needle in a haystack.
The door analysis workflow in Vyssuals transforms this into an interactive, iterative process. Start with the dashboard charts that give you the big picture - see total door count at a glance, identify doors by type, level, or any parameter, and spot missing or incomplete door data. The charts group doors by type to understand distribution and verify consistent assignments, while spatial analysis shows door distribution by level and validates placement against room functions.
But here's where it gets powerful: click on any chart element or use the context table to drill down to individual door instances. The context table shows you the most important parameters for the doors you're focusing on, filtered by your current selection. You can spot complex parameter dependencies - like doors with automatic closers missing the required fire rating that determines whether automatic closure is mandatory.
Then comes the seamless back-and-forth: select a problematic door right from the dashboard, jump into Revit to fix the issue, and watch the data update in real-time as you return to Vyssuals. The dashboard immediately reflects your changes, showing you've resolved the problem or highlighting the next issue to tackle. This iterative workflow - chart overview → context table detail → Revit fix → dashboard verification - turns what used to be hours of manual cross-referencing into a fluid, visual process that catches issues before they become problems.
Structural Engineers: Column and Beam Analysis
As an architect by training, I've integrated structural models into overall building models, and from a data perspective, structural engineers face the exact same challenges we do - just with different parameters. When a column has the wrong base constraint or a beam is missing its structural material, it can cause serious problems downstream. Through conversations with structural professionals, I've learned they need the same workflow: charts to analyze material assignments, verify constraints and offsets, and ensure consistent parameter usage across all structural elements.
MEP Designers: System Classification
Similarly, MEP designers face the same data coordination challenges. I've integrated MEP models into architectural models and understand that the fundamental workflow is identical - just applied to mechanical, electrical, and plumbing elements. Through conversations with MEP professionals, I've learned that they struggle with the same data coordination issues - missing system assignments, inconsistent parameters, and coordination gaps across disciplines. The solution is the same interactive dashboard approach that works for architectural and structural elements, just applied to mechanical, electrical, and plumbing systems.
The Bottom Line: Same Data Problems, Same Solution
Whether you're an architect managing room programs and door schedules, a structural engineer tracking column constraints and beam materials, or an MEP designer coordinating system assignments, you're all dealing with the same fundamental challenge: too many parameters across too many elements to verify manually.
The workflow is identical across all disciplines: identify the parameters that matter for your analysis, create charts to group and visualize the data, drill down to individual elements when you spot issues, and verify fixes in real-time. The only difference is which elements and parameters you're analyzing.
That's why Vyssuals works for everyone: it's not about architectural data or structural data or MEP data - it's about BIM data. And BIM data follows the same patterns regardless of discipline. When you can see your data clearly, grouped logically, and drill down instantly to the elements that need attention, you solve the same problems that every AEC professional faces: missing parameters, inconsistent assignments, coordination gaps, and the time wasted trying to find these issues manually.
I built this tool because while I could control all that Revit data through computational design and Python programming, I wanted everyone on the team to benefit. My hacky prototypes built for individual projects weren't accessible to others. Vyssuals gives everyone the same power I had.
Want to see Vyssuals in action? Check out our Getting Started Guide for step-by-step instructions, or explore our Chart Configuration Guide to learn advanced techniques.