Welcome to Vyssuals! This guide will walk you through everything you need to know to get started with the most powerful BIM data visualization tool for Revit users. Whether you're an architect, engineer, or BIM coordinator, you'll be up and running in minutes.
What You'll Need
- Revit 2022-2027 (any version)
- Vyssuals Revit Connector (we'll download this first)
- Vyssuals.com account (free to start)
Step 1: Download and Install the Revit Connector
Before you can use Vyssuals, you need to install the Revit plugin that connects your model to the web dashboard. This is a local connection, no data leaves your system.
- Download the installer: Once you are logged in, download the installer from the web app
- Run the installer: Double-click the downloaded file and follow the installation wizard
- Restart Revit: Close and reopen Revit to load the new plugin
The connector will appear in your Add-Ins tab under the Vyssuals section.
Step 2: Create Your Vyssuals Account
- Go to Vyssuals.com
- Click "Get Started for Free" or "Login" if you already have an account
- Sign up with your work email address or google account
- Click the link in the email to complete the login (if you used your email to sign in)
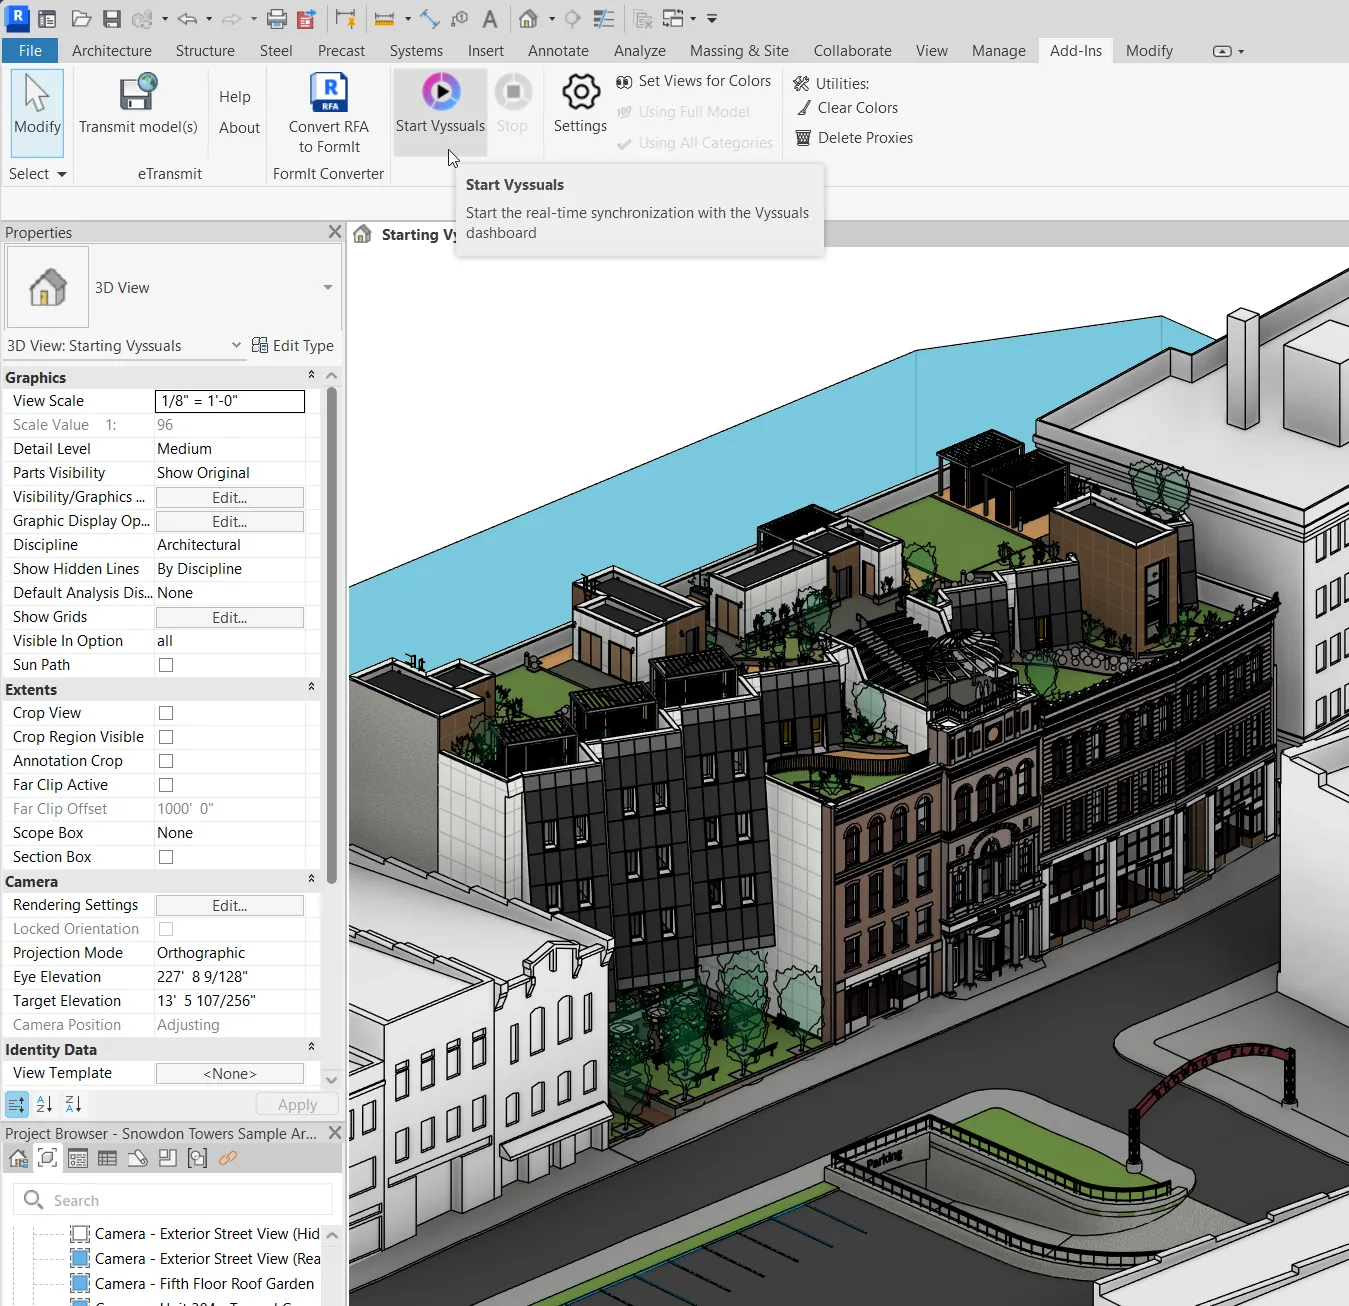
Step 3: Connect Revit to Vyssuals
- Open your Revit model (or create a new one)
- Go to the Add-Ins tab in Revit
- Find the Vyssuals section (usually on the right side)
- Click "Start" to begin the connection
The connector will automatically:
- Open your default browser and navigate to vyssuals.com/app
- Establish the connection between Revit and the browser
- Begin syncing your model data in real-time
Step 4: Create Your First Chart (3 Clicks!)
Creating charts in Vyssuals is incredibly simple:
- Click on a category (like "Walls" or "Doors") in the left sidebar
- Click on a parameter (like "Fire Rating" or "Height")
- Your chart appears instantly!
That's it! Vyssuals automatically configures your first chart:
- Text parameters → Showing element counts per value of the parameter you selected
- Number parameters → Showing aggregated values of the parameter you selected grouped by type name
Step 5: Explore Your Data
Use the Categories Panel
- Left sidebar shows all categories in your model
- Click any category to see all its parameters (in parameters panel on the right)
Use the Parameters Panel
- Right sidebar shows parameters for selected categories
- Spot incomplete data using the %-filled column
- Hover over parameters to preview charts before creating them
- Click to create charts instantly
Interactive Features
- Click on chart bars to see detailed information
- Use the context table to drill down into specific elements
- Select elements in Revit directly from your dashboard
Selecting elements in Revit can be done in two ways:
- By clicking on a bar or pie of a chart
- By clicking on the mouse curson icon in the context table
Step 6: Filter and Focus
Dashboard-wide Filters
- Filter by category, level, or any parameter
- Use fuzzy search - even with typos!
Cross-filtering
- Click on one chart to highlight related data in other charts
- See relationships between different data sets instantly
Step 7: Customize Your Charts
Chart Editor
- Click the pen icon on the chart to open the editor
- Change chart types (bar, donut, line, etc.)
- Add or remove categories to specify what kind of elements your chart should show.
- Adjust the parameters used by changing 'Group By' and 'Show Values Of'
- Add filters in the 'Advanced filters' section. Create as many as needed, and combine them with 'AND' or 'OR' logic.
- Adjust colors and styling - choose between a color palette and a gradient, or even select a color scheme from Revit.
Color palette is beneficial for showing categorical data. Gradient is best if you have a number parameter as the group by parameter.
For a detailed explanation of chart configuration principles, check out our Chart Configuration Basics guide.
Save Your Work
- Create dashboard templates for yourself ('Personal')
- Share configurations save a template under 'From My Organization' (requires admin rights)
Even if you don't save your dashboard as a template, Vyssuals will remember where you left off using your browser's cache. But this also means that when you clear your cache, the current working dashboard will be deleted. Therefore, we always recommend that you save your dashboard as a template.
Saving templates has multiple benefits:
- Avoid losing your work in case you accidentally clear your browser cache
- Switch between dashboards easily
- Reuse dashboards on any other project you work on
- Share with your co-workers
- Set up standards for your company
Pro Tips for New Users
Start Simple
- Begin with basic categories like "Walls" or "Doors" (You can always try multi-category charts later)
- Focus on one parameter at a time
- Use the auto-generated charts before customizing
Common Use Cases
- Room analysis: Check room areas and counts
- Door schedules: Verify door types and properties
- Material quantities: Track wall and floor materials
- Model health: Identify missing or incorrect data
Performance Tips
- Use selective categories for very large models (in Revit connector settings)
- Pause sync when not actively working with data
Troubleshooting
Connection Issues
- Verify the Revit connector is running - Some operations require us to stop the sync to ensure the data in the web app remains in sync with the model. In these cases, you will need to click the 'Start' button again.
- Make sure only one vyssuals.com/app tab is open - we have implemented smart logic to automatically manage the tabs, but there are security restrictions on browsers that limit what we can do. These restrictions are very important for your online safety and we don't want to miss them.
- Restart Revit if needed.
No Data Showing
- Check your filters - they are extremely powerful for getting to the data you need, but it can also mean you are filtering out things by accident.
- Ensure Revit is connected (look for a blue dot in the bottom left corner of the web app)
- Check that your model has elements - yep...
- Check category selection - maybe there are no elements in that category?
Slow Performance
- Use selective categories instead of full model sync
- Limit to visible elements only
- Close other resource-intensive applications
What's Next?
Once you're comfortable with the basics:
- Explore advanced chart types like rules and ratios
- Create dashboard templates for your team
- Set up automated quality checks for your projects
- Integrate with your existing workflows - we are always happy to help you with this!
Need Help?
Contact our support team at contact@yssentyl.com
We really mean this! There are no stupid questions and we are always eager to help you out or explain things to ensure you get the best possible experience with Vyssuals!
The Bottom Line
Vyssuals transforms how you work with Revit data. Instead of exporting to Excel or struggling with complex BI tools, you get instant insights that help you make better design decisions.
From setup to your first chart in under 1 minute - that's the power of Vyssuals.
Ready to see your Revit data in a whole new light? Get started today and discover what your BIM data can really tell you.
This guide covers the basics to get you started. For more advanced features and workflows, check out our other blog articles and tutorial videos.