TRUST THE DATA, YOU WILL.
Correct
Revit Models
Vyssuals gives you full control over BIM model data
and ensures you deliver perfect projects every time.
Because data quality is building quality.


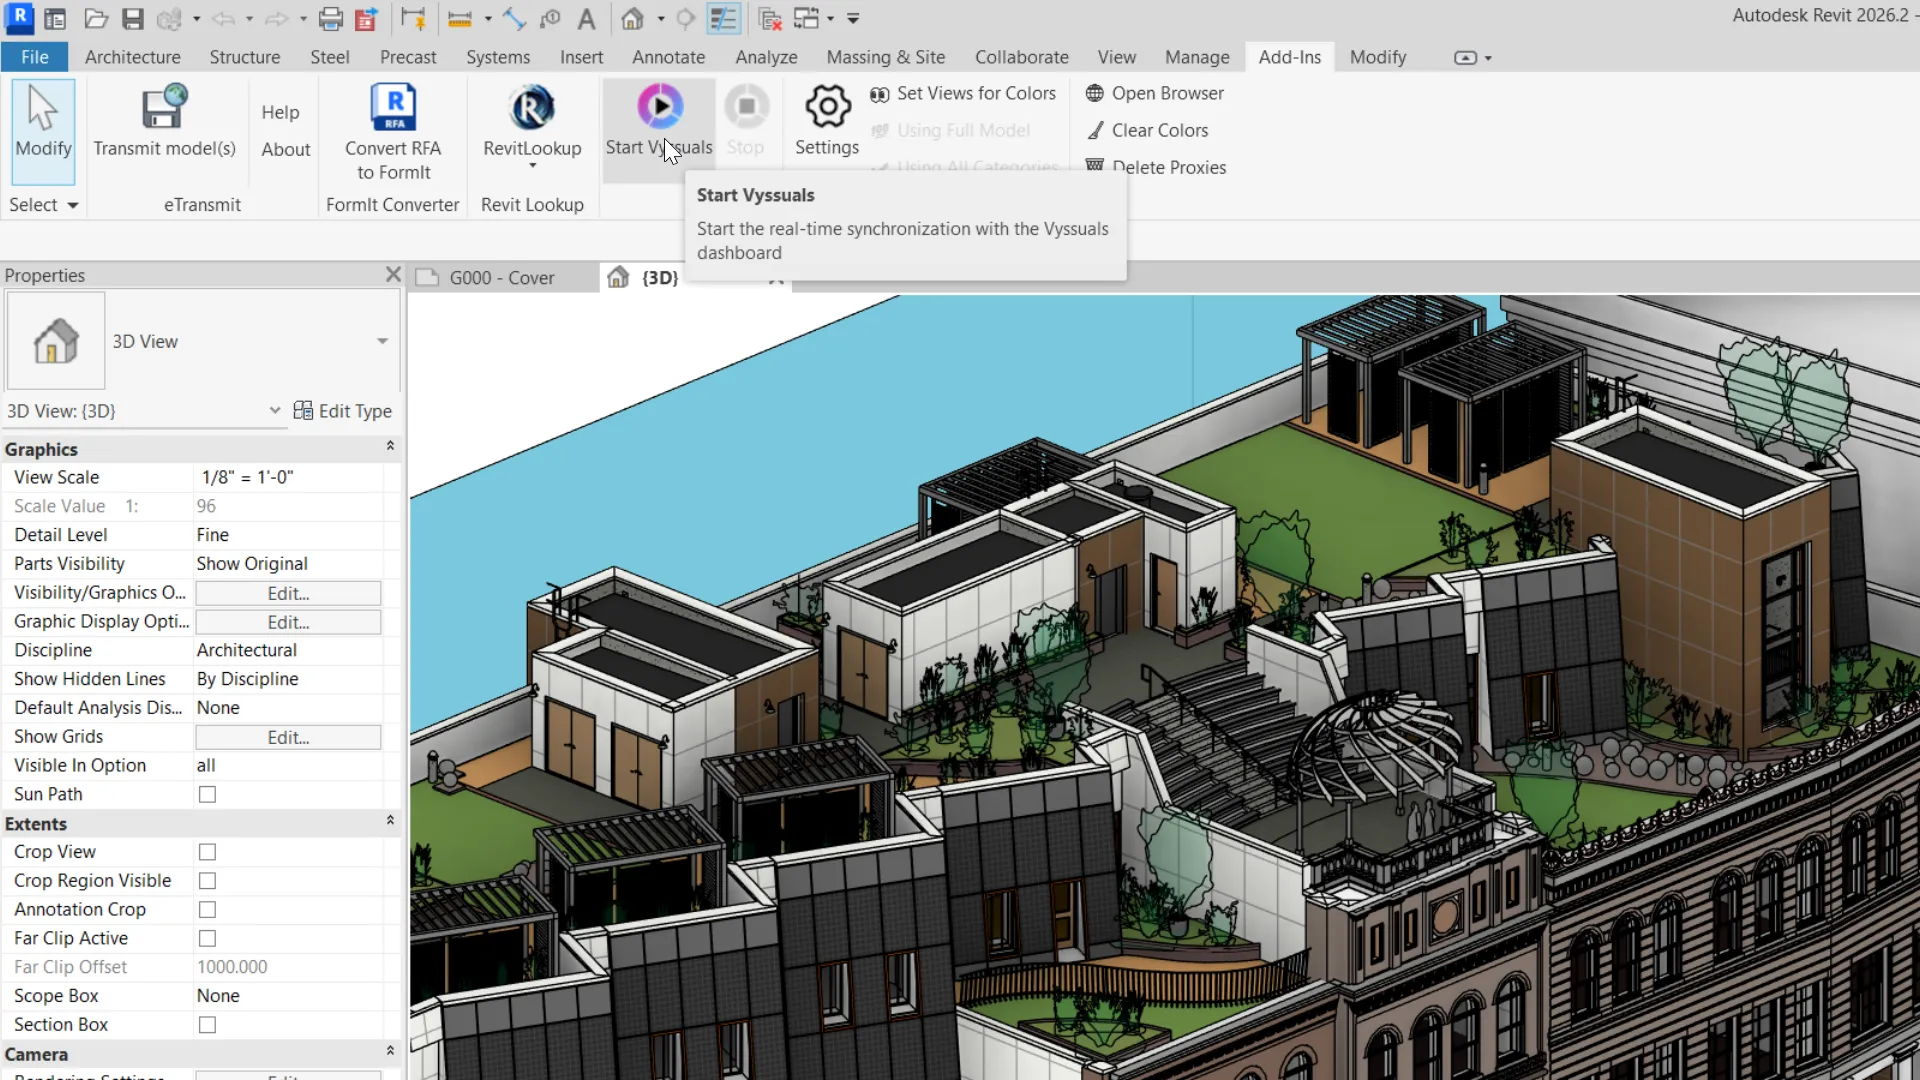
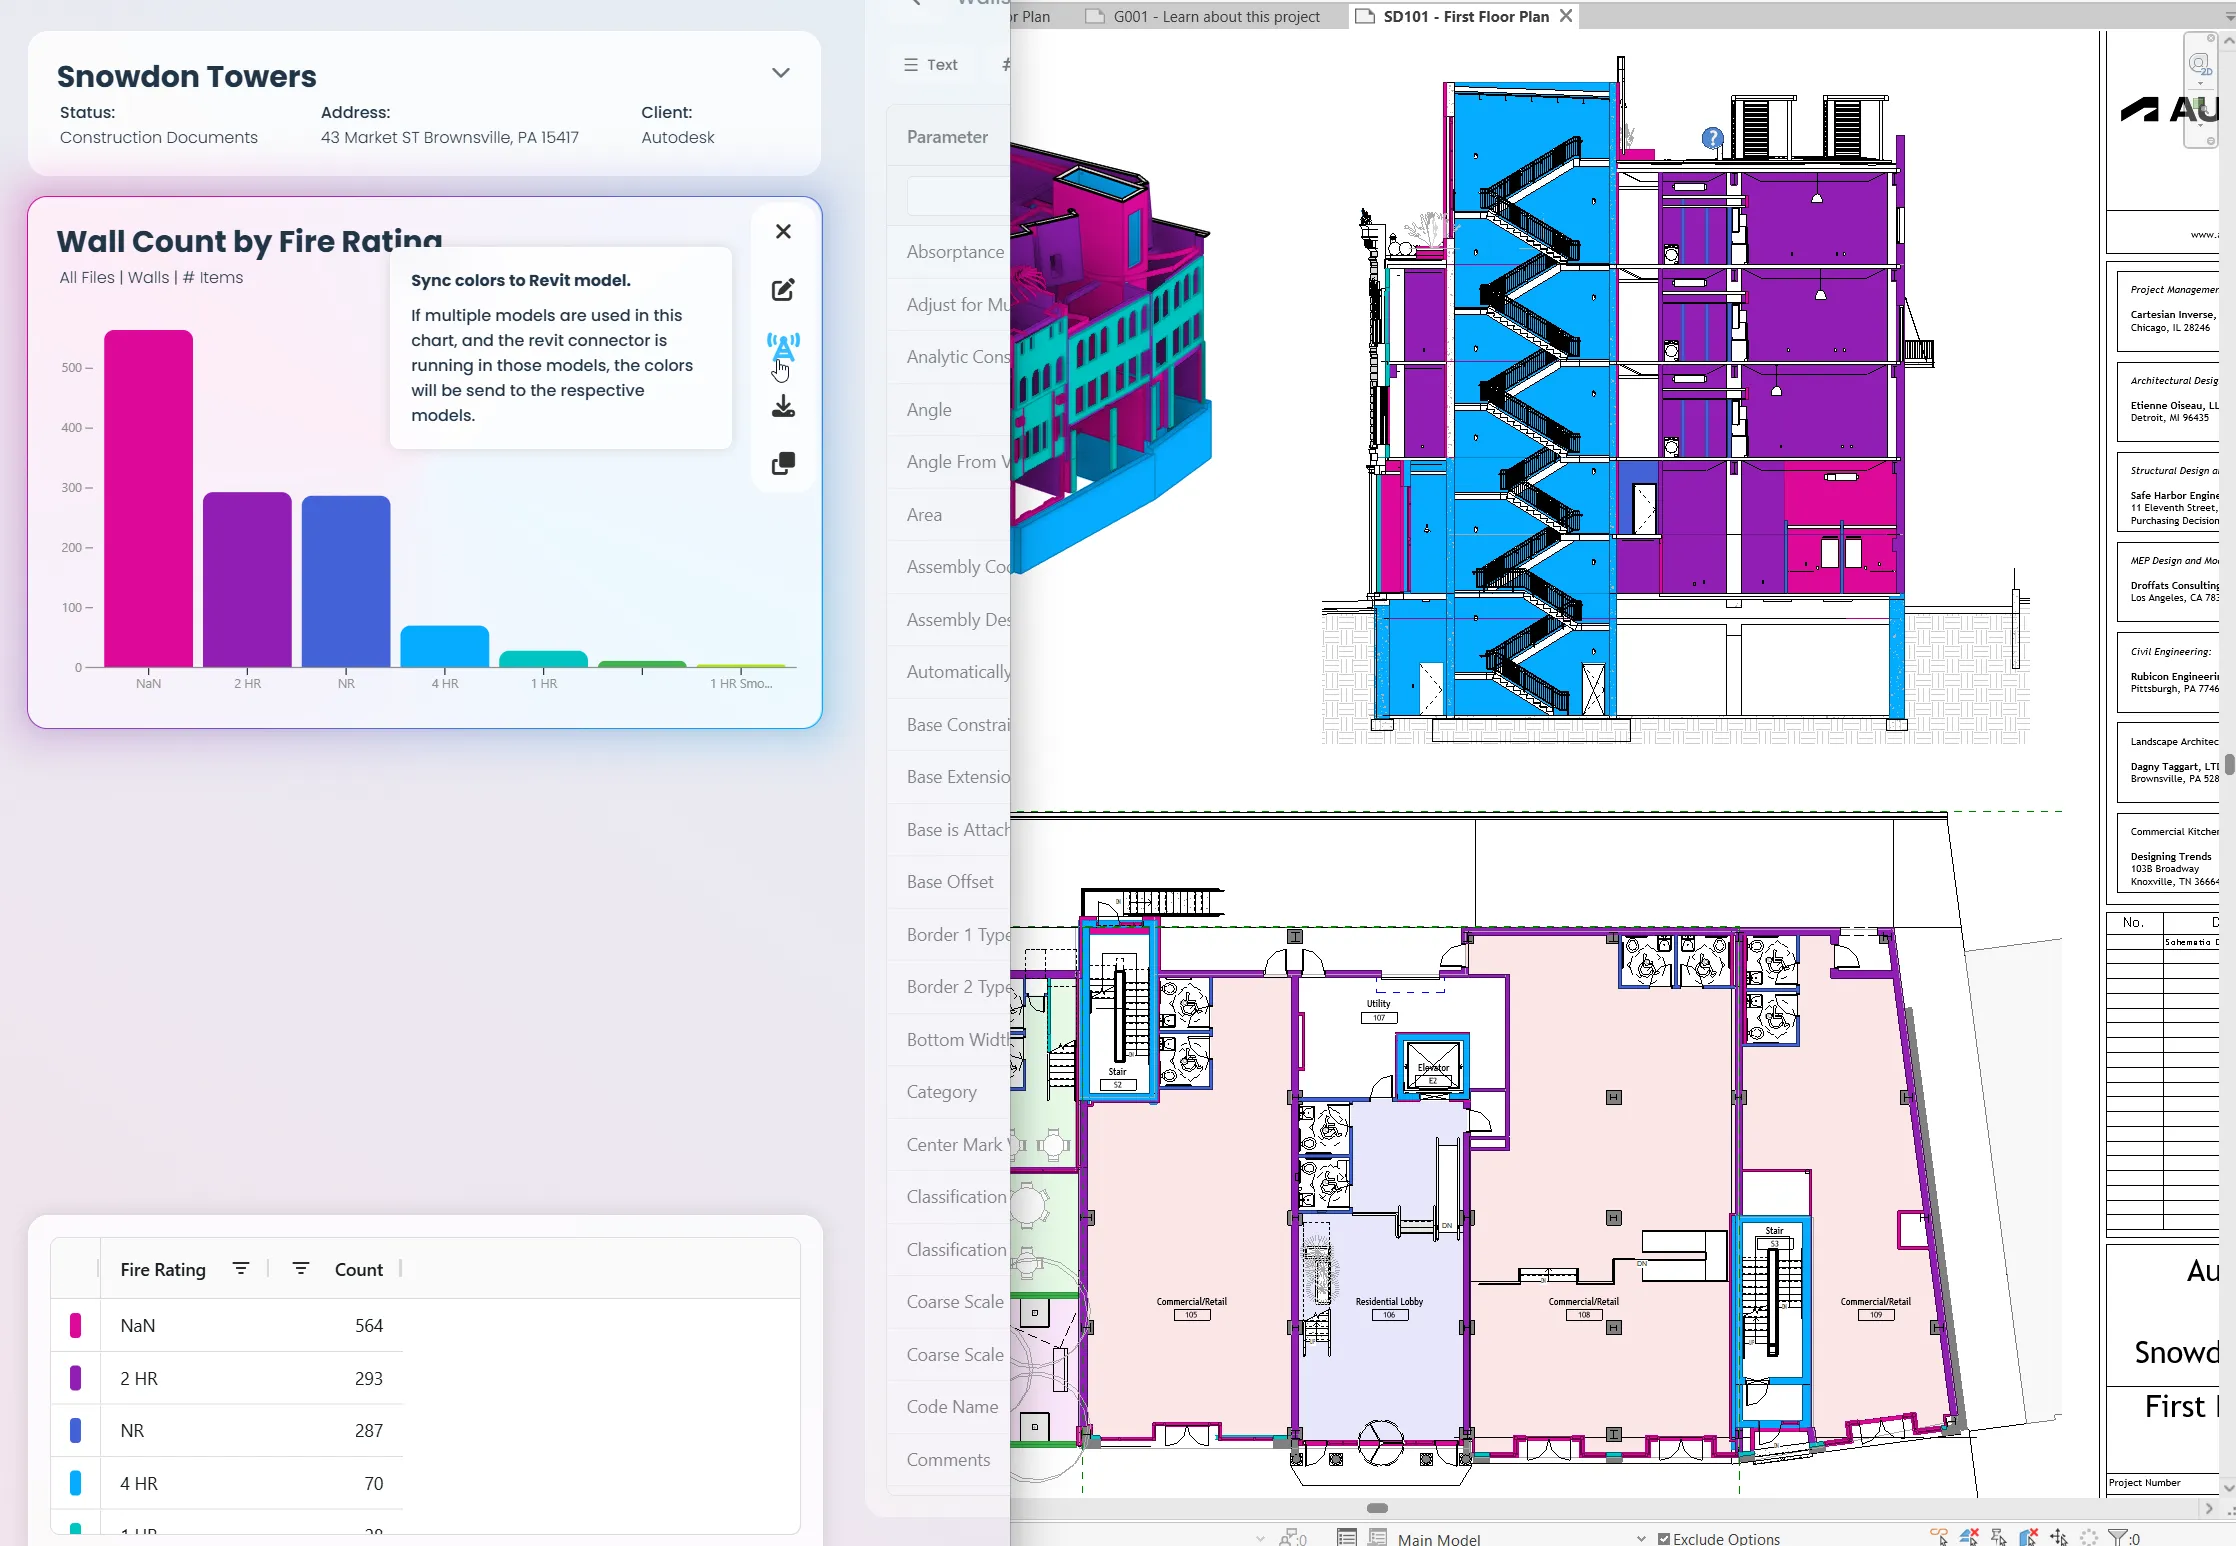
From Revit to dashboard and back.
Sync model data in real-time.
Color your model from the dashboard.
Select Revit elements from a chart.
Skip exports,
simplify setups.
Create BIM data visualisations from Revit with just 3 clicks.
1. Start
the live dashboard.
2. Select a category
3. Select a parameter.
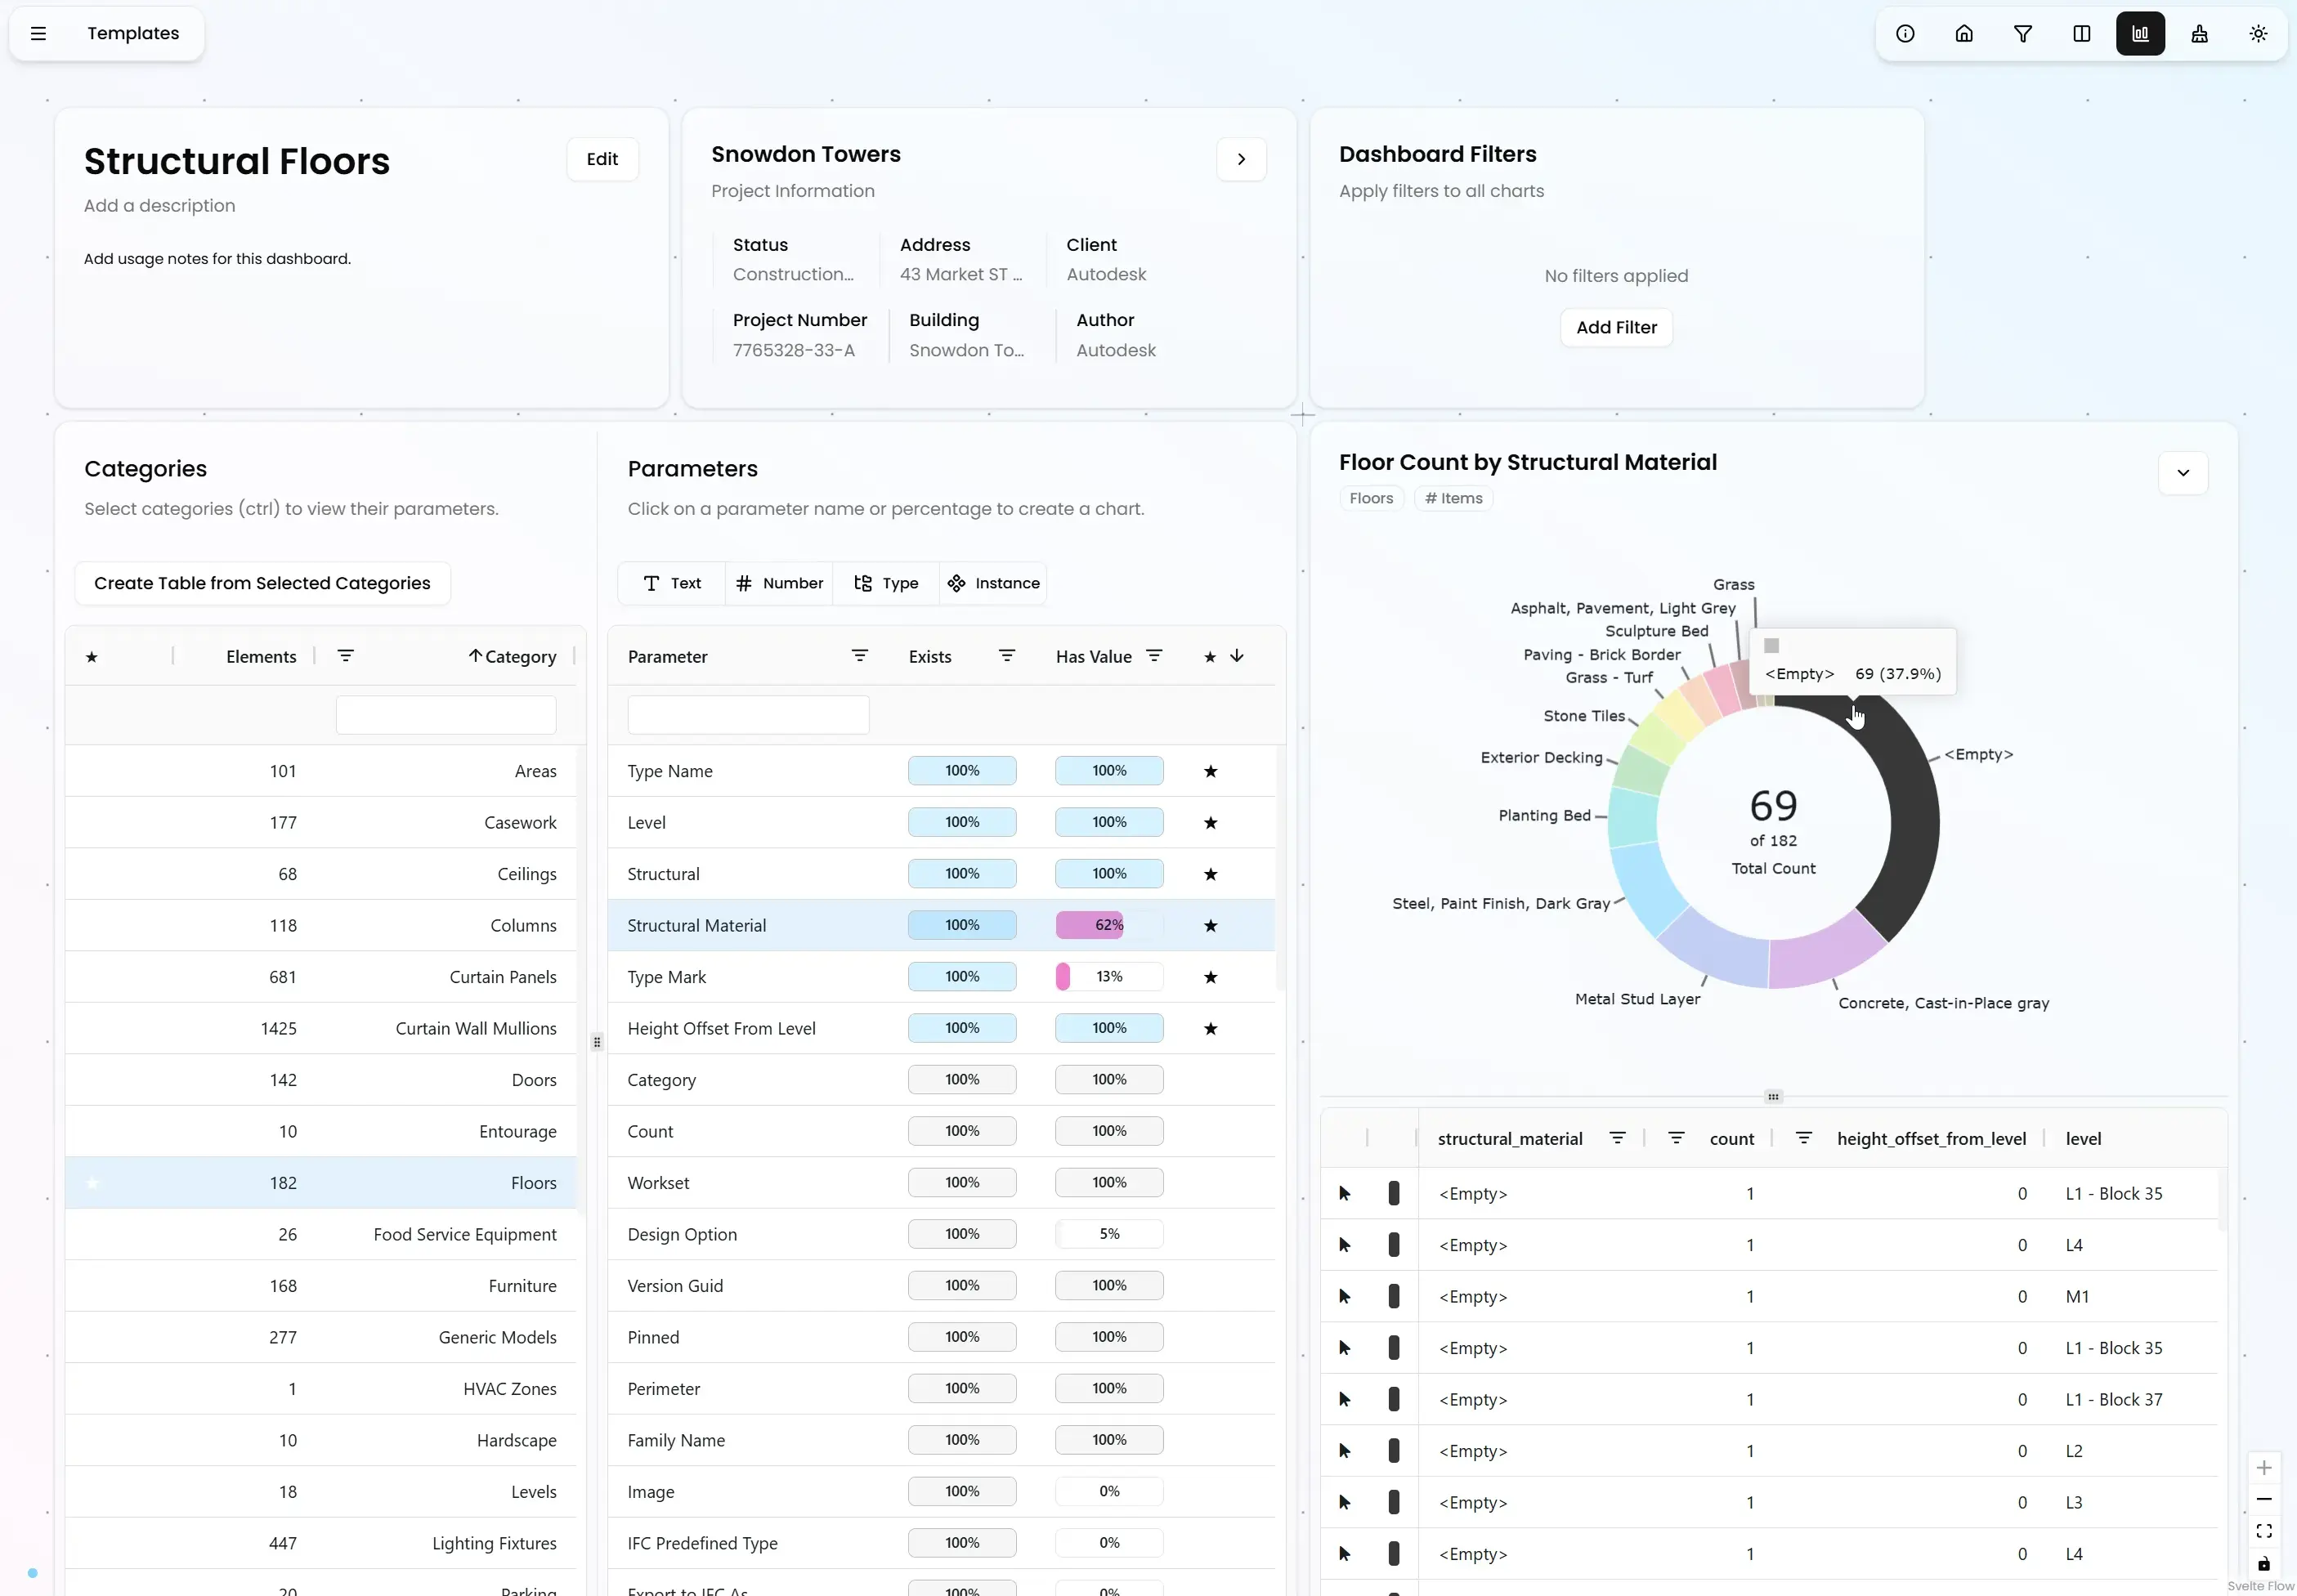
Regain control,
master your data.
No more information overload.
Focus on parameters that actually matter and be 100% sure they are correct. BIM
quality management made easy.
Easy to implement.
For everyone on your team.
Revit users will feel right at home
and dashboard templates allow all team members regardless of their technical skills to deliver outstanding project quality. Integrates perfectly into existing workflows and
all data stays local.
This is not another platform.
Your Revit model stays the source of truth.
But without sacrificing data quality.
As a team, we use Vyssuals to define and apply our information standards as dashboard templates across all projects. Working collaboratively inside Revit, we refine our models in real time and ensure that our data stays consistent from start to finish.

Founding Partner at weberbrunner architekten
With some cruise ships containing over 10,000 rooms, I needed an accurate 3D visualisation of all that data—something Revit can’t natively provide for rooms. As a BIM Manager, my role is to catch the mistakes others miss, and Vyssuals gives me the visibility I need to do exactly that. Plus, our clients love the colour-coded models we share on ACC.

Head of BIM at SMC-Design
I'm using Vyssuals to manage 50+ parameters in my door schedules. I get the job done much faster, and I know everything is correct. That accuracy pays off for me later when the information is used in construction and planning—I don't have to worry about errors coming back to bite me.

Founding Partner at Kirchner.Studio
Vyssuals lets me check models directly in Revit before I export to RIB iTWO. I can quickly see if the model has everything I need for my estimation work, and I don't have to export first. Best part for me: when my clients use Vyssuals, we both save time and money by catching missing data before I start the estimate, eliminating costly back-and-forth that wastes my time.

Founder at jboegershausen
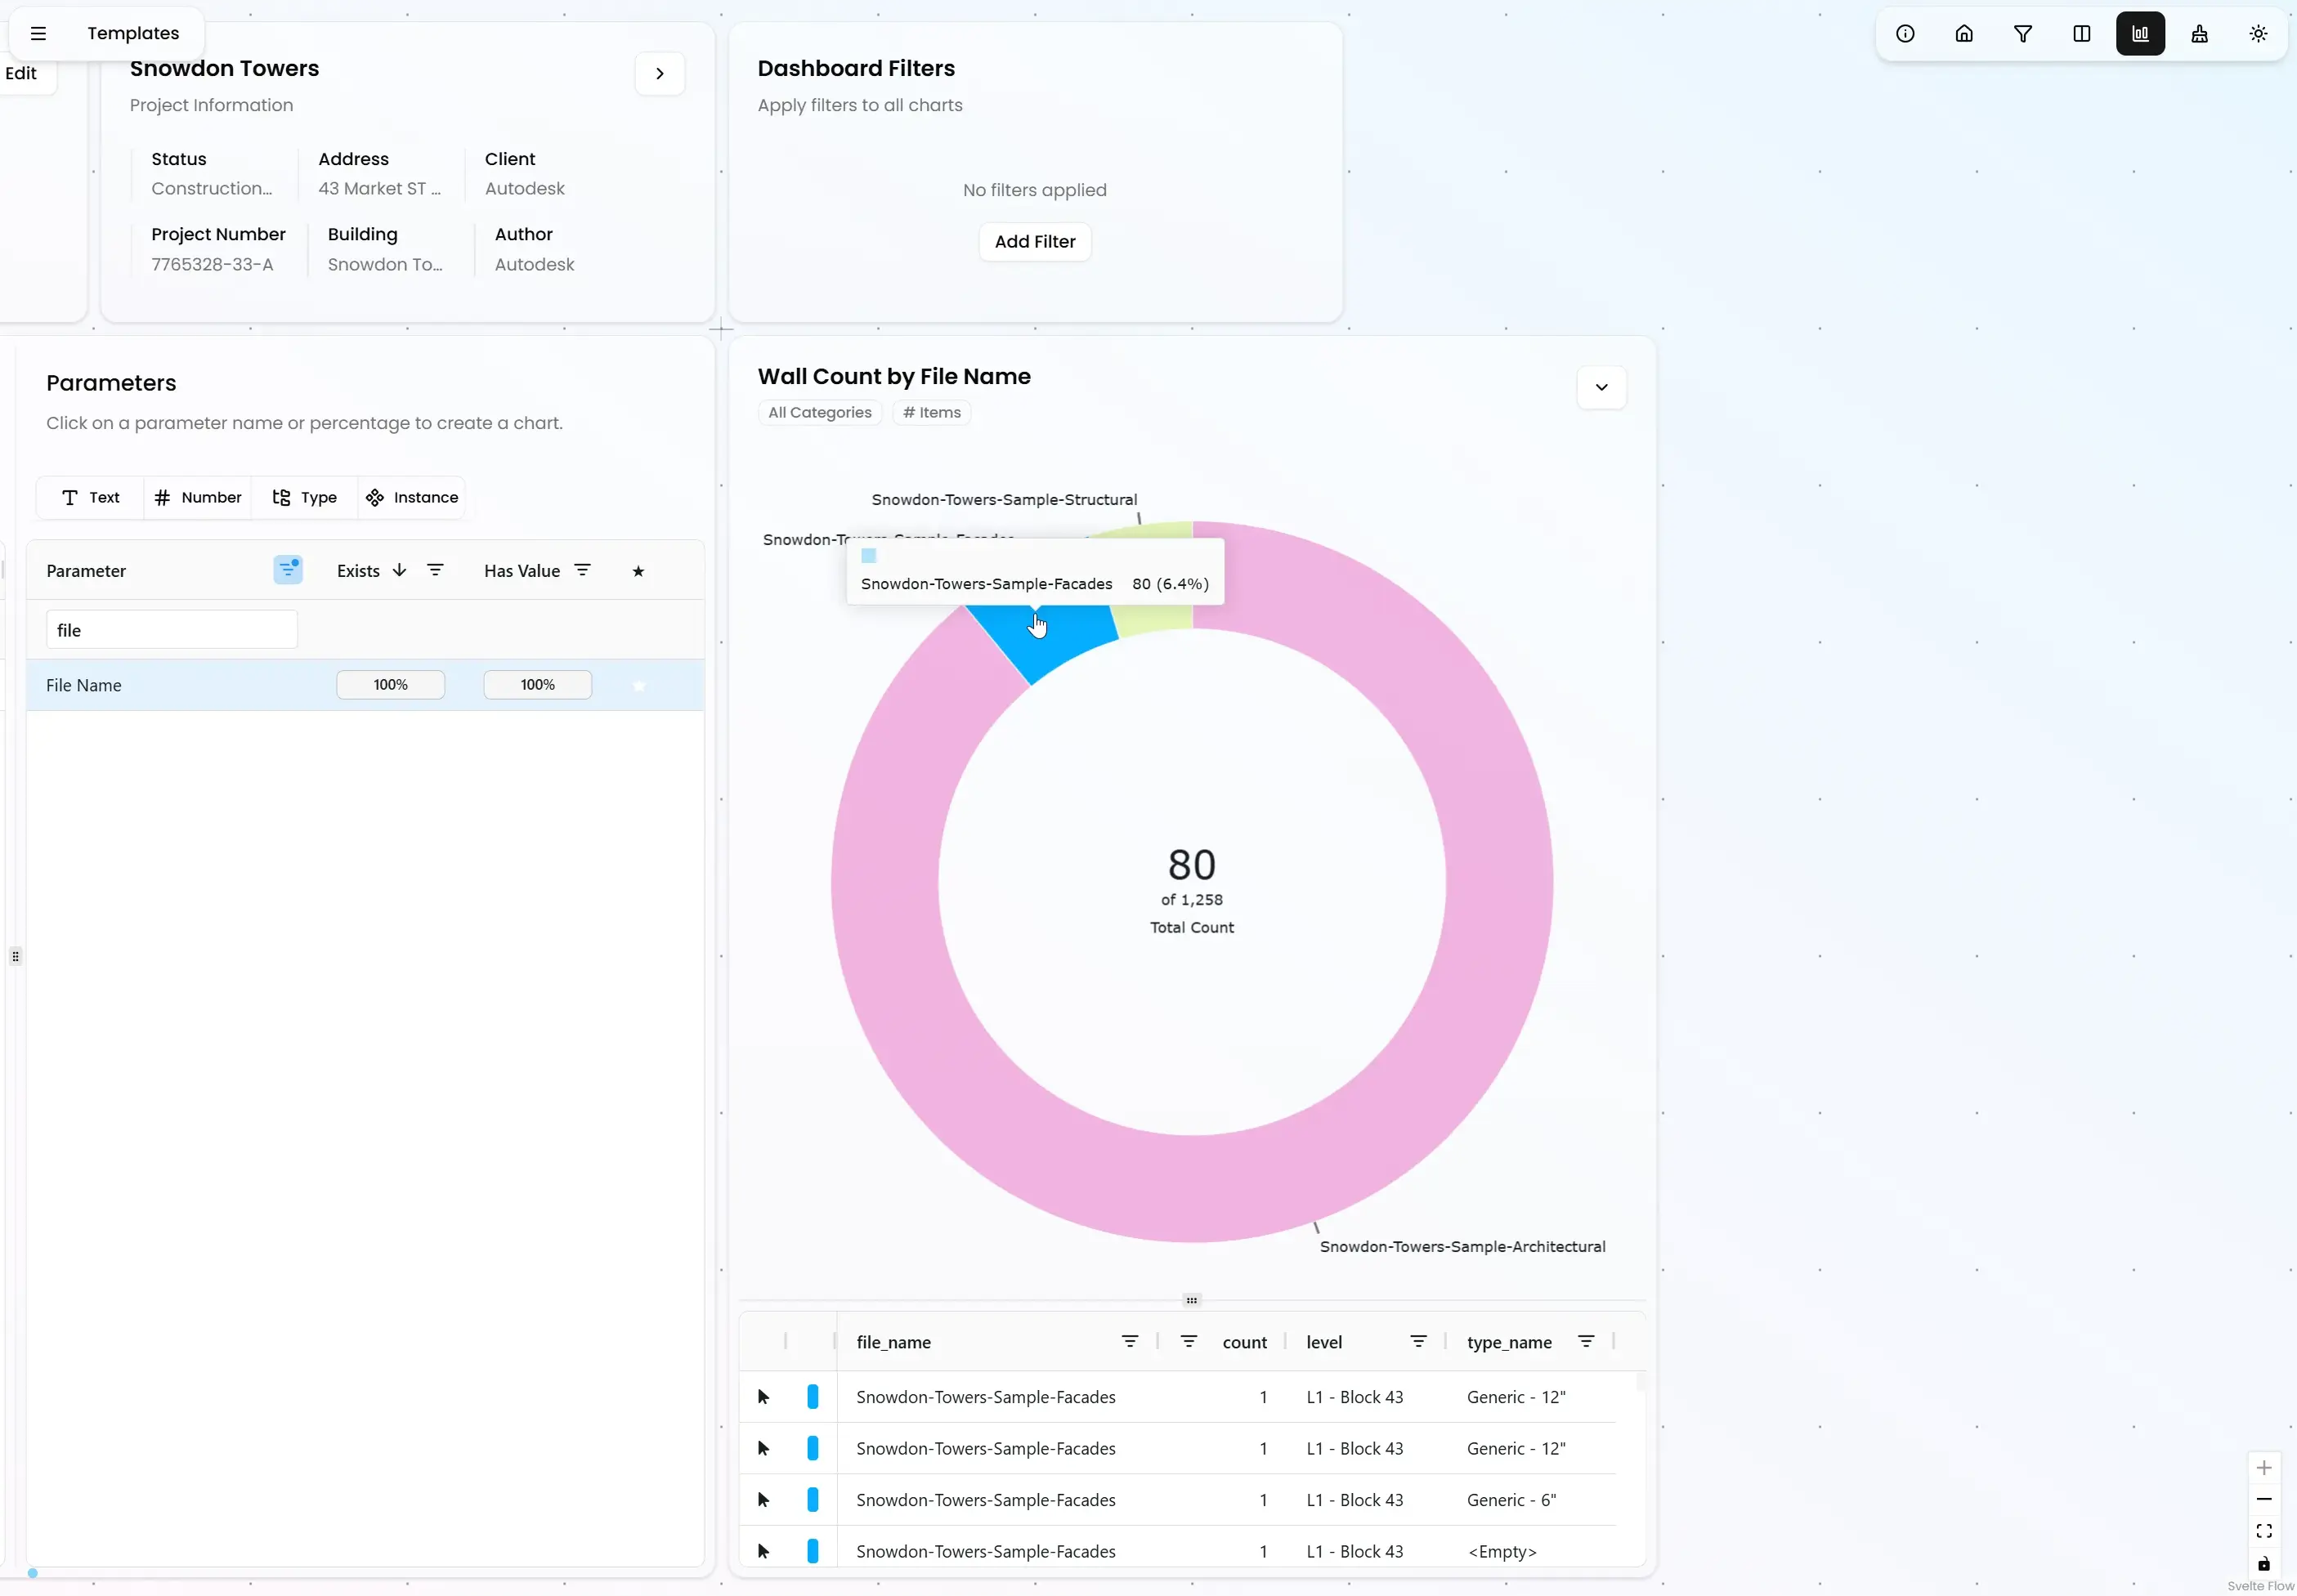
Load data from Linked Files so you don't have to open multiple Revit Models for a full project overview.
Colorize multiple Revit views to create information rich presentation sheets.
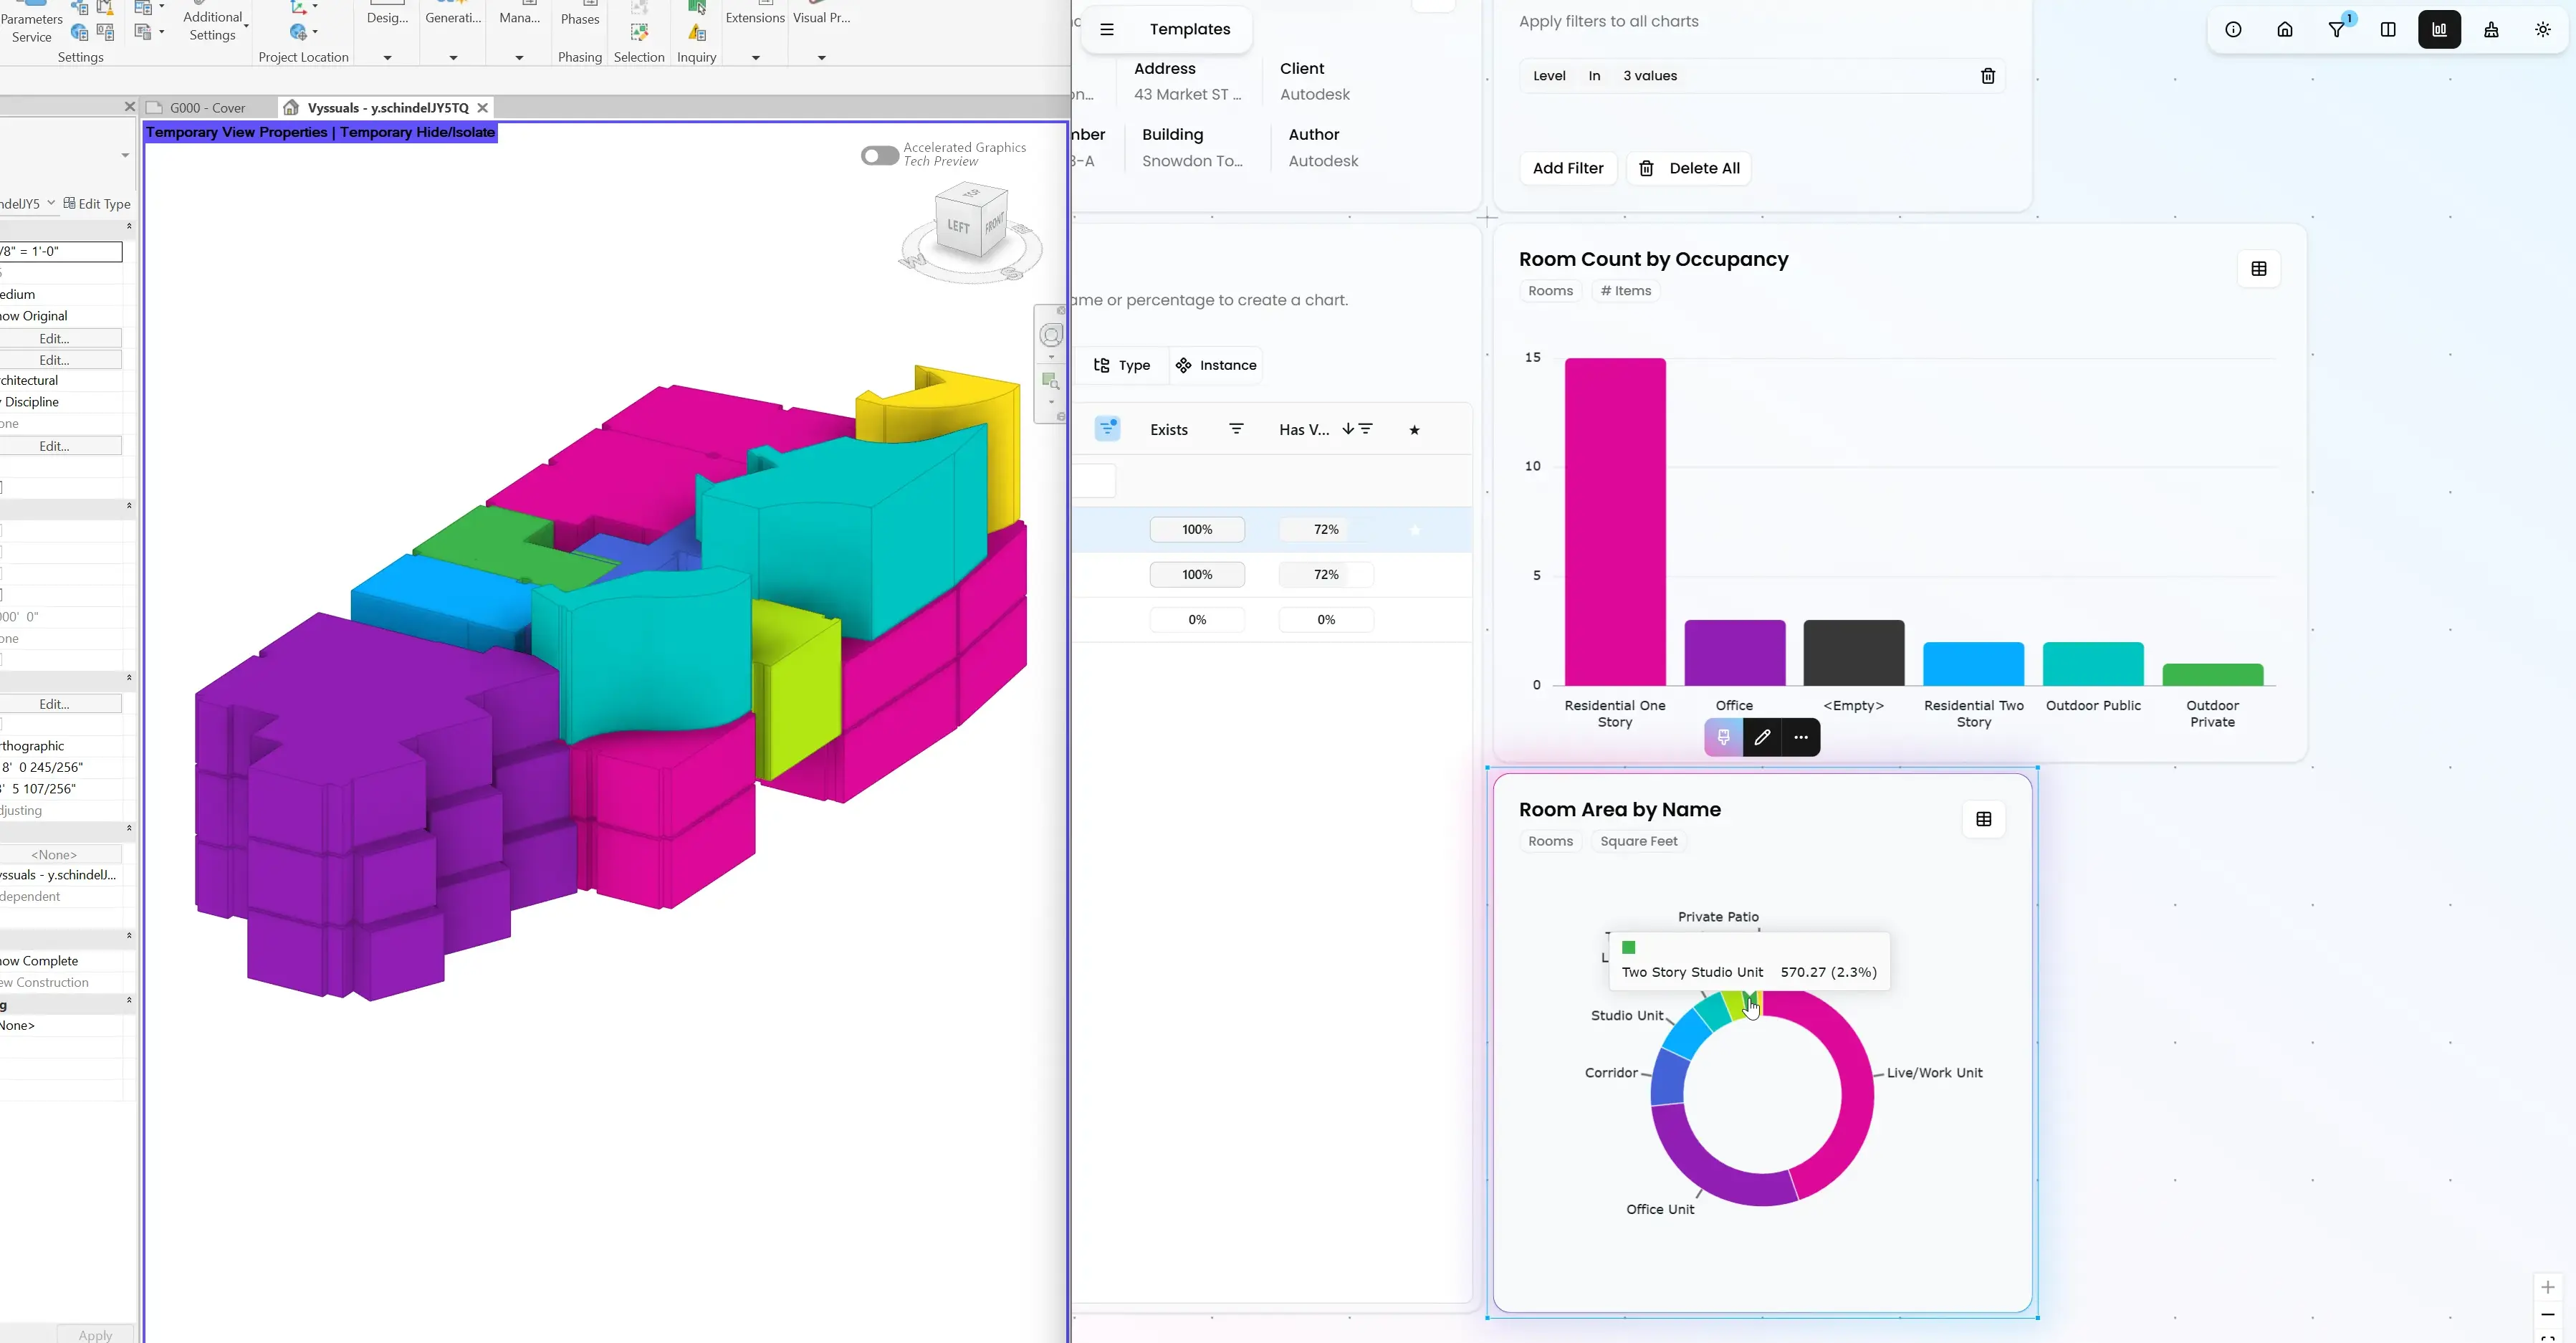
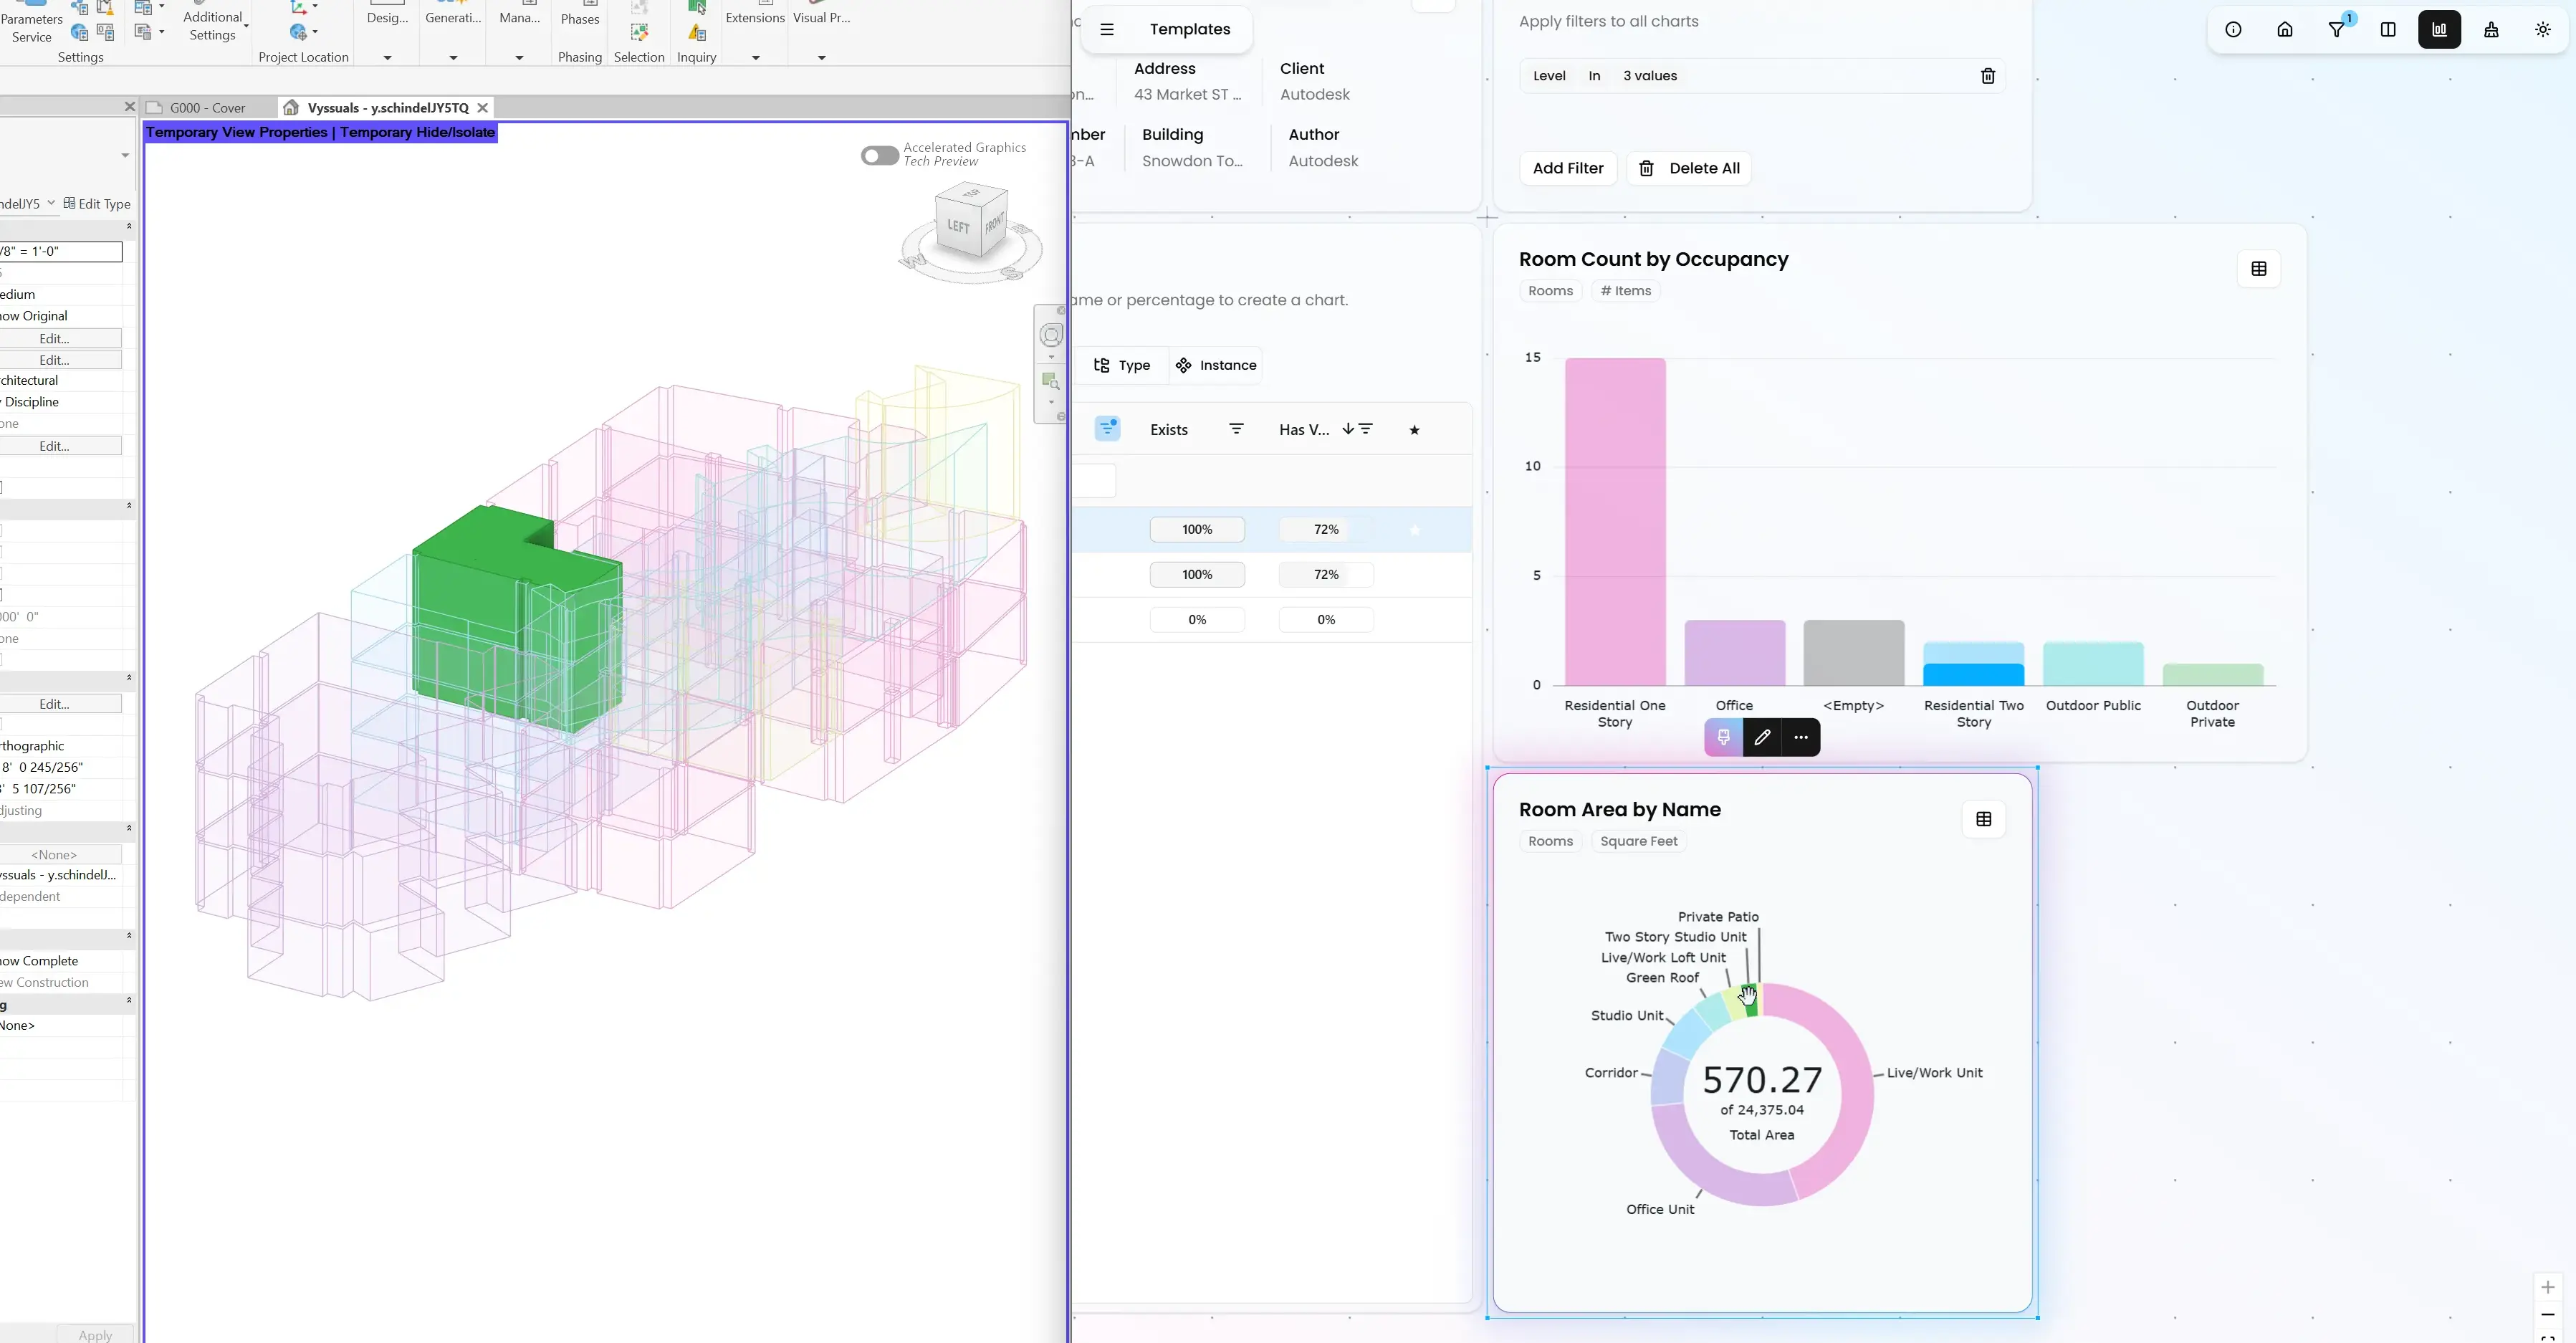
See your rooms and areas in 3D and color them with your Revit color schemes.
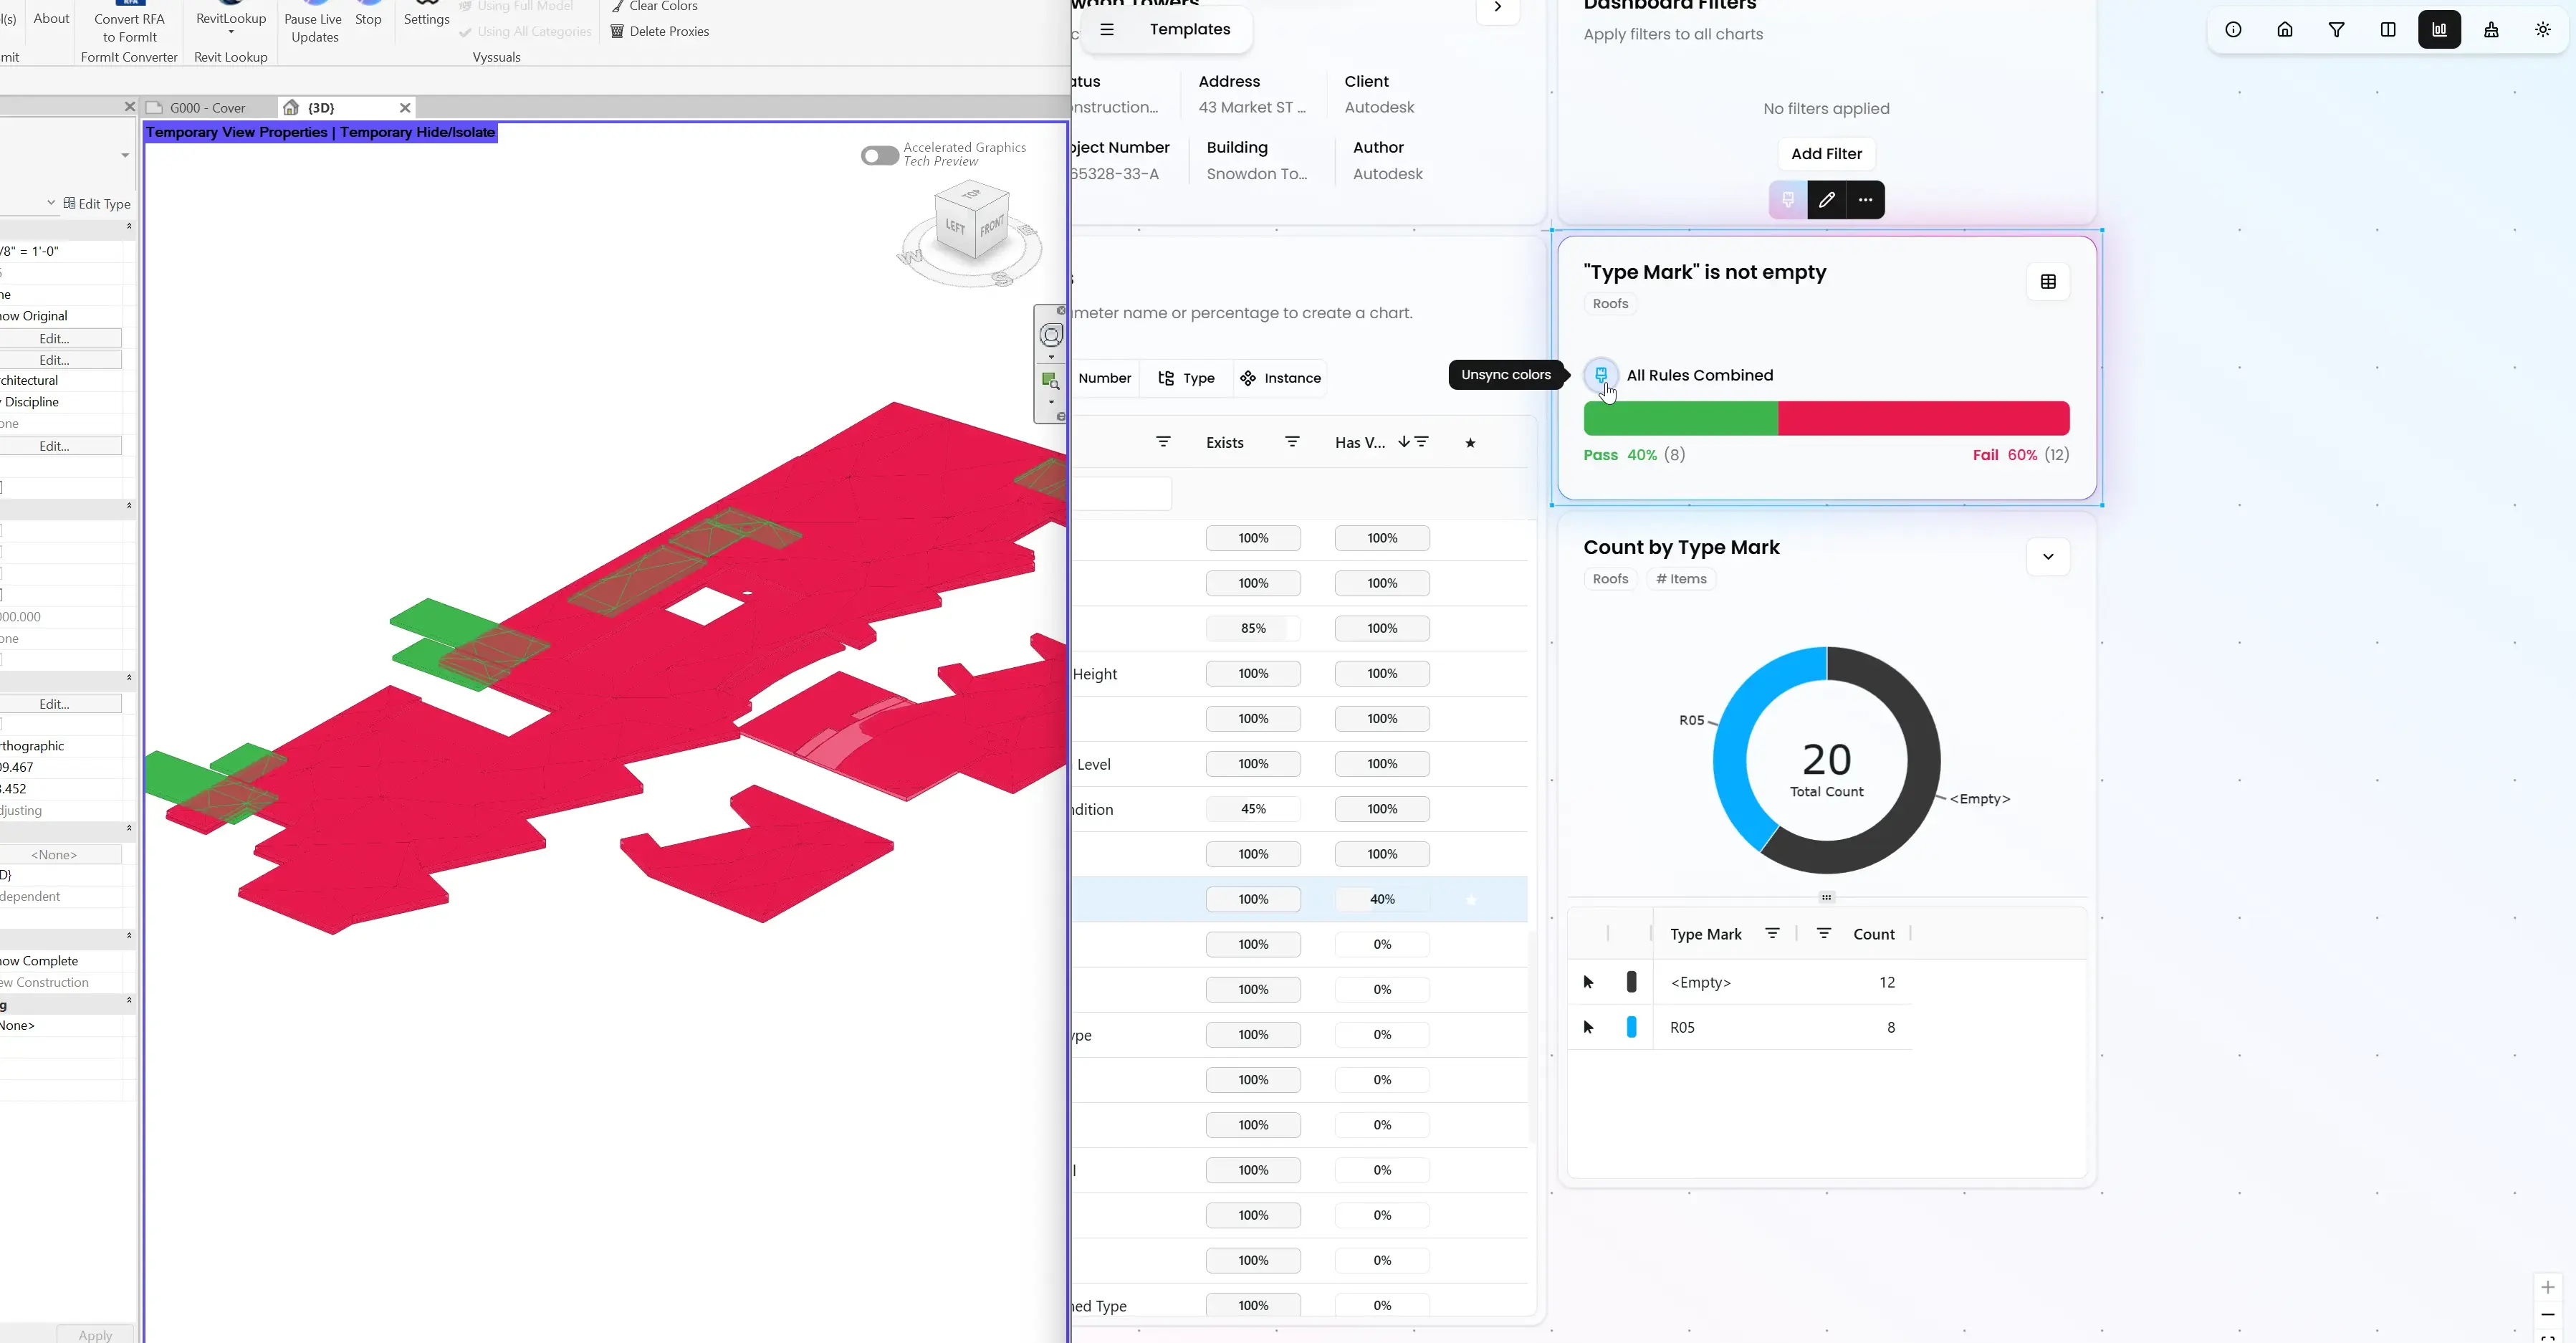
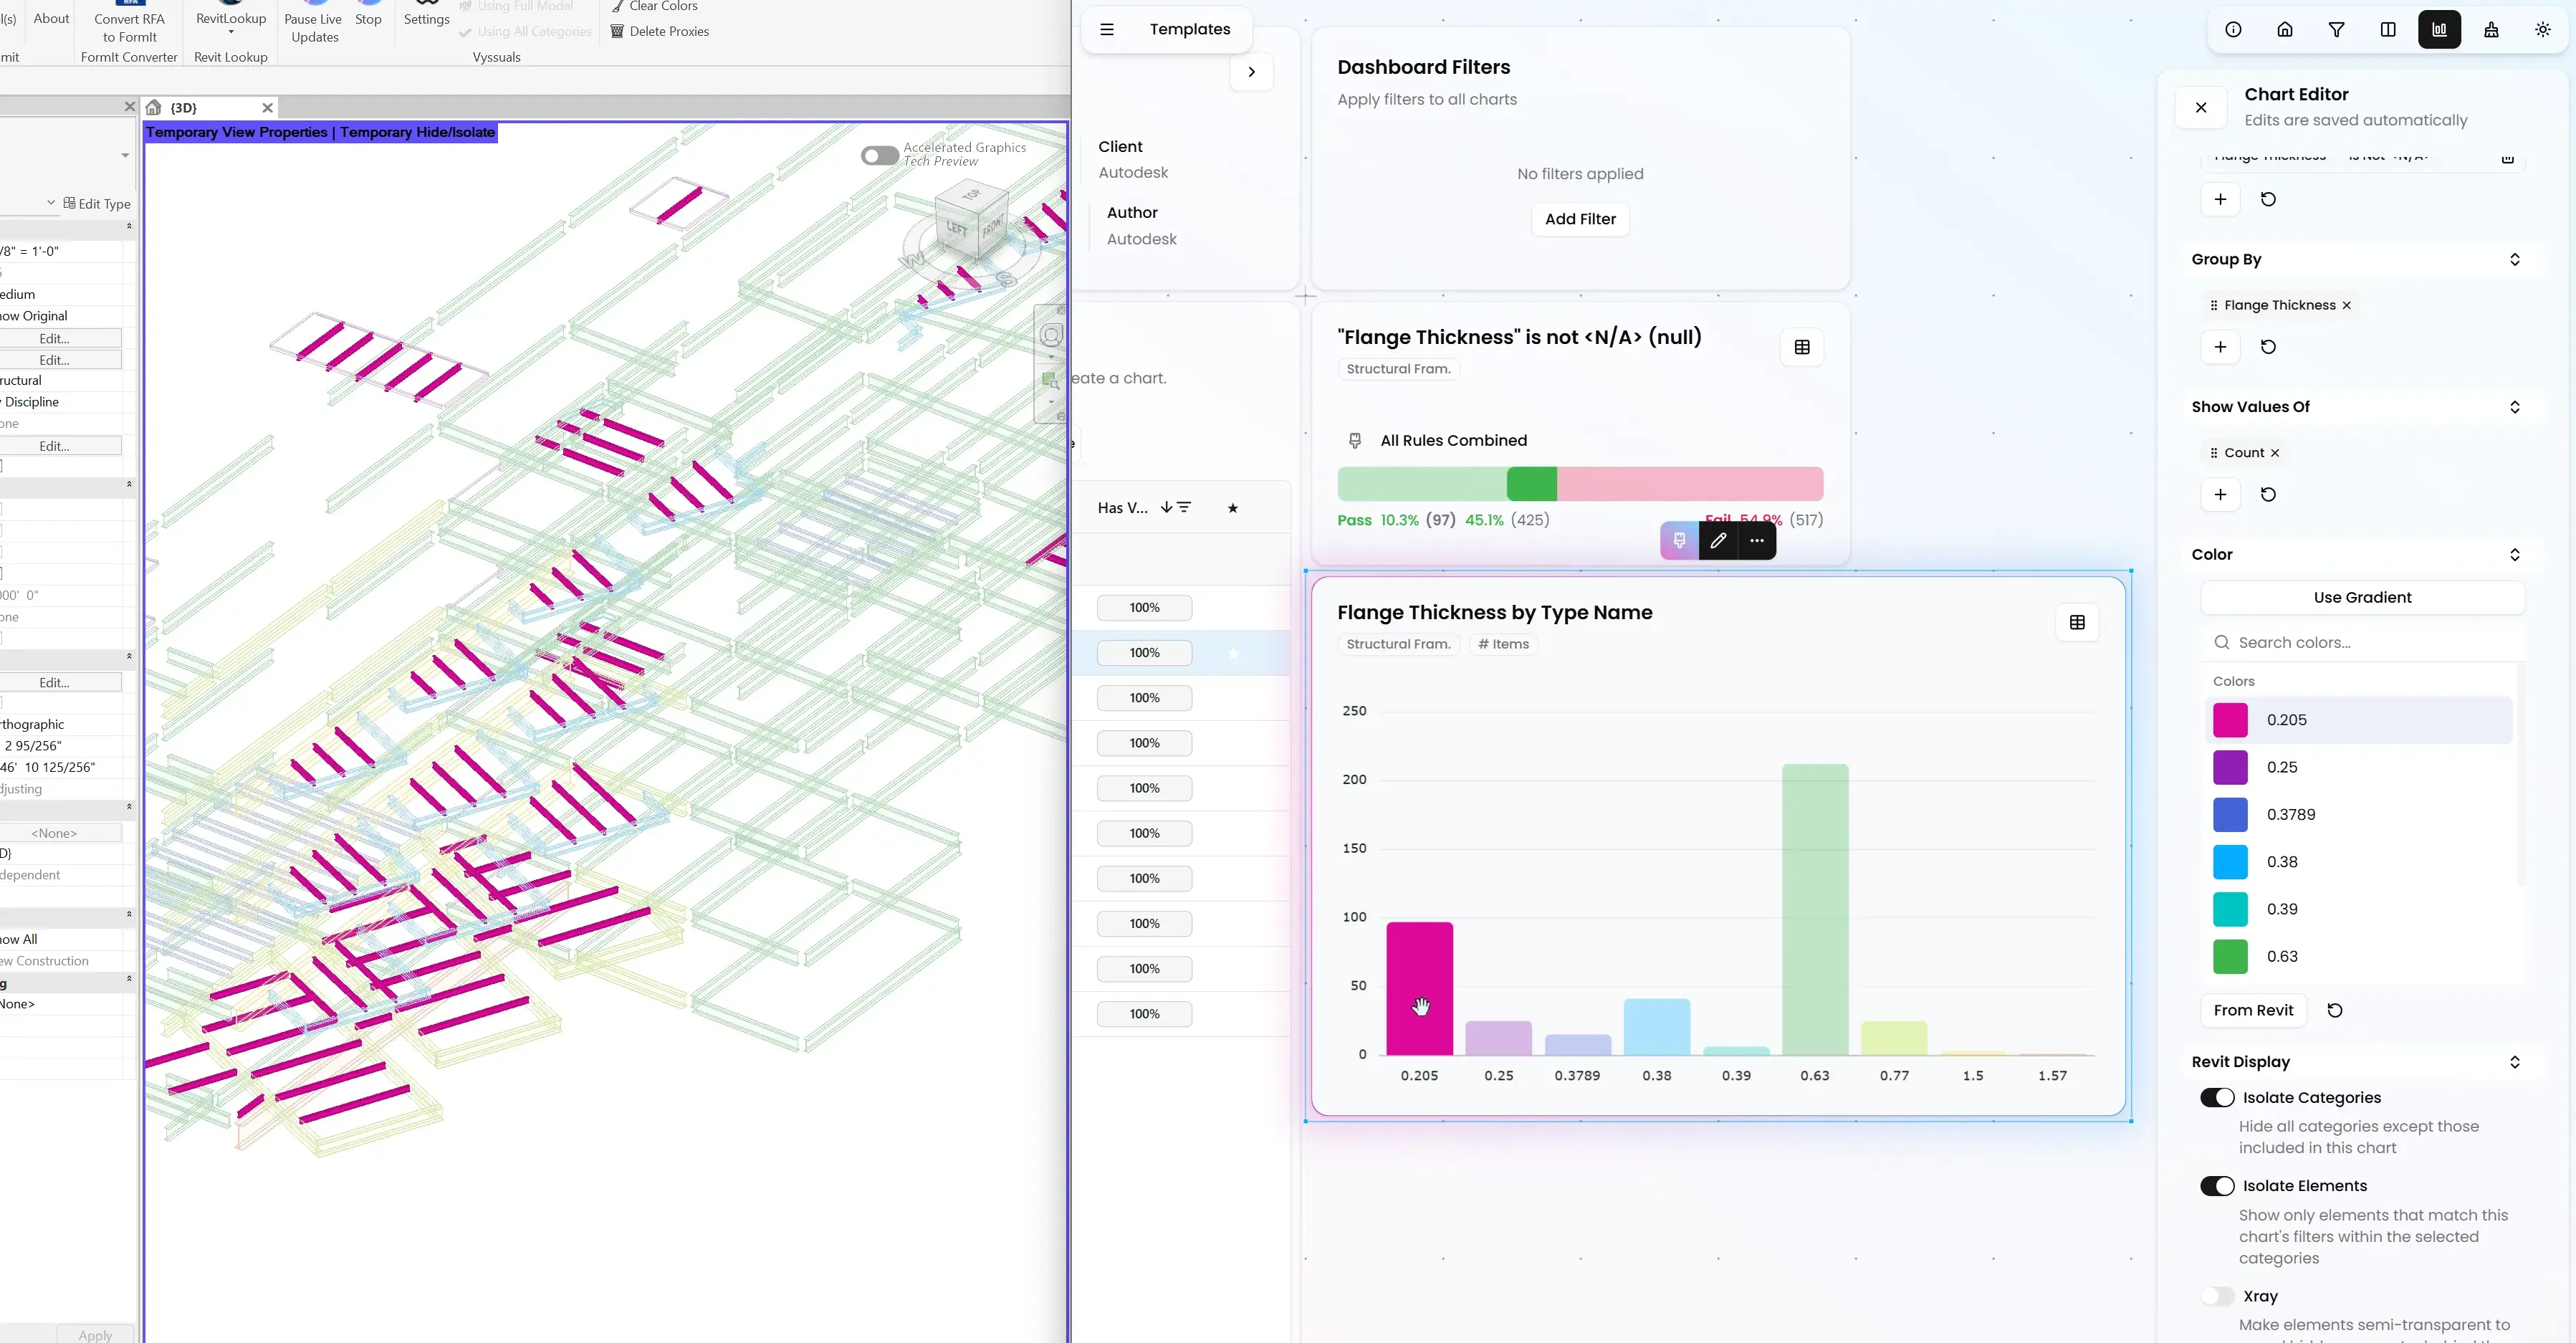
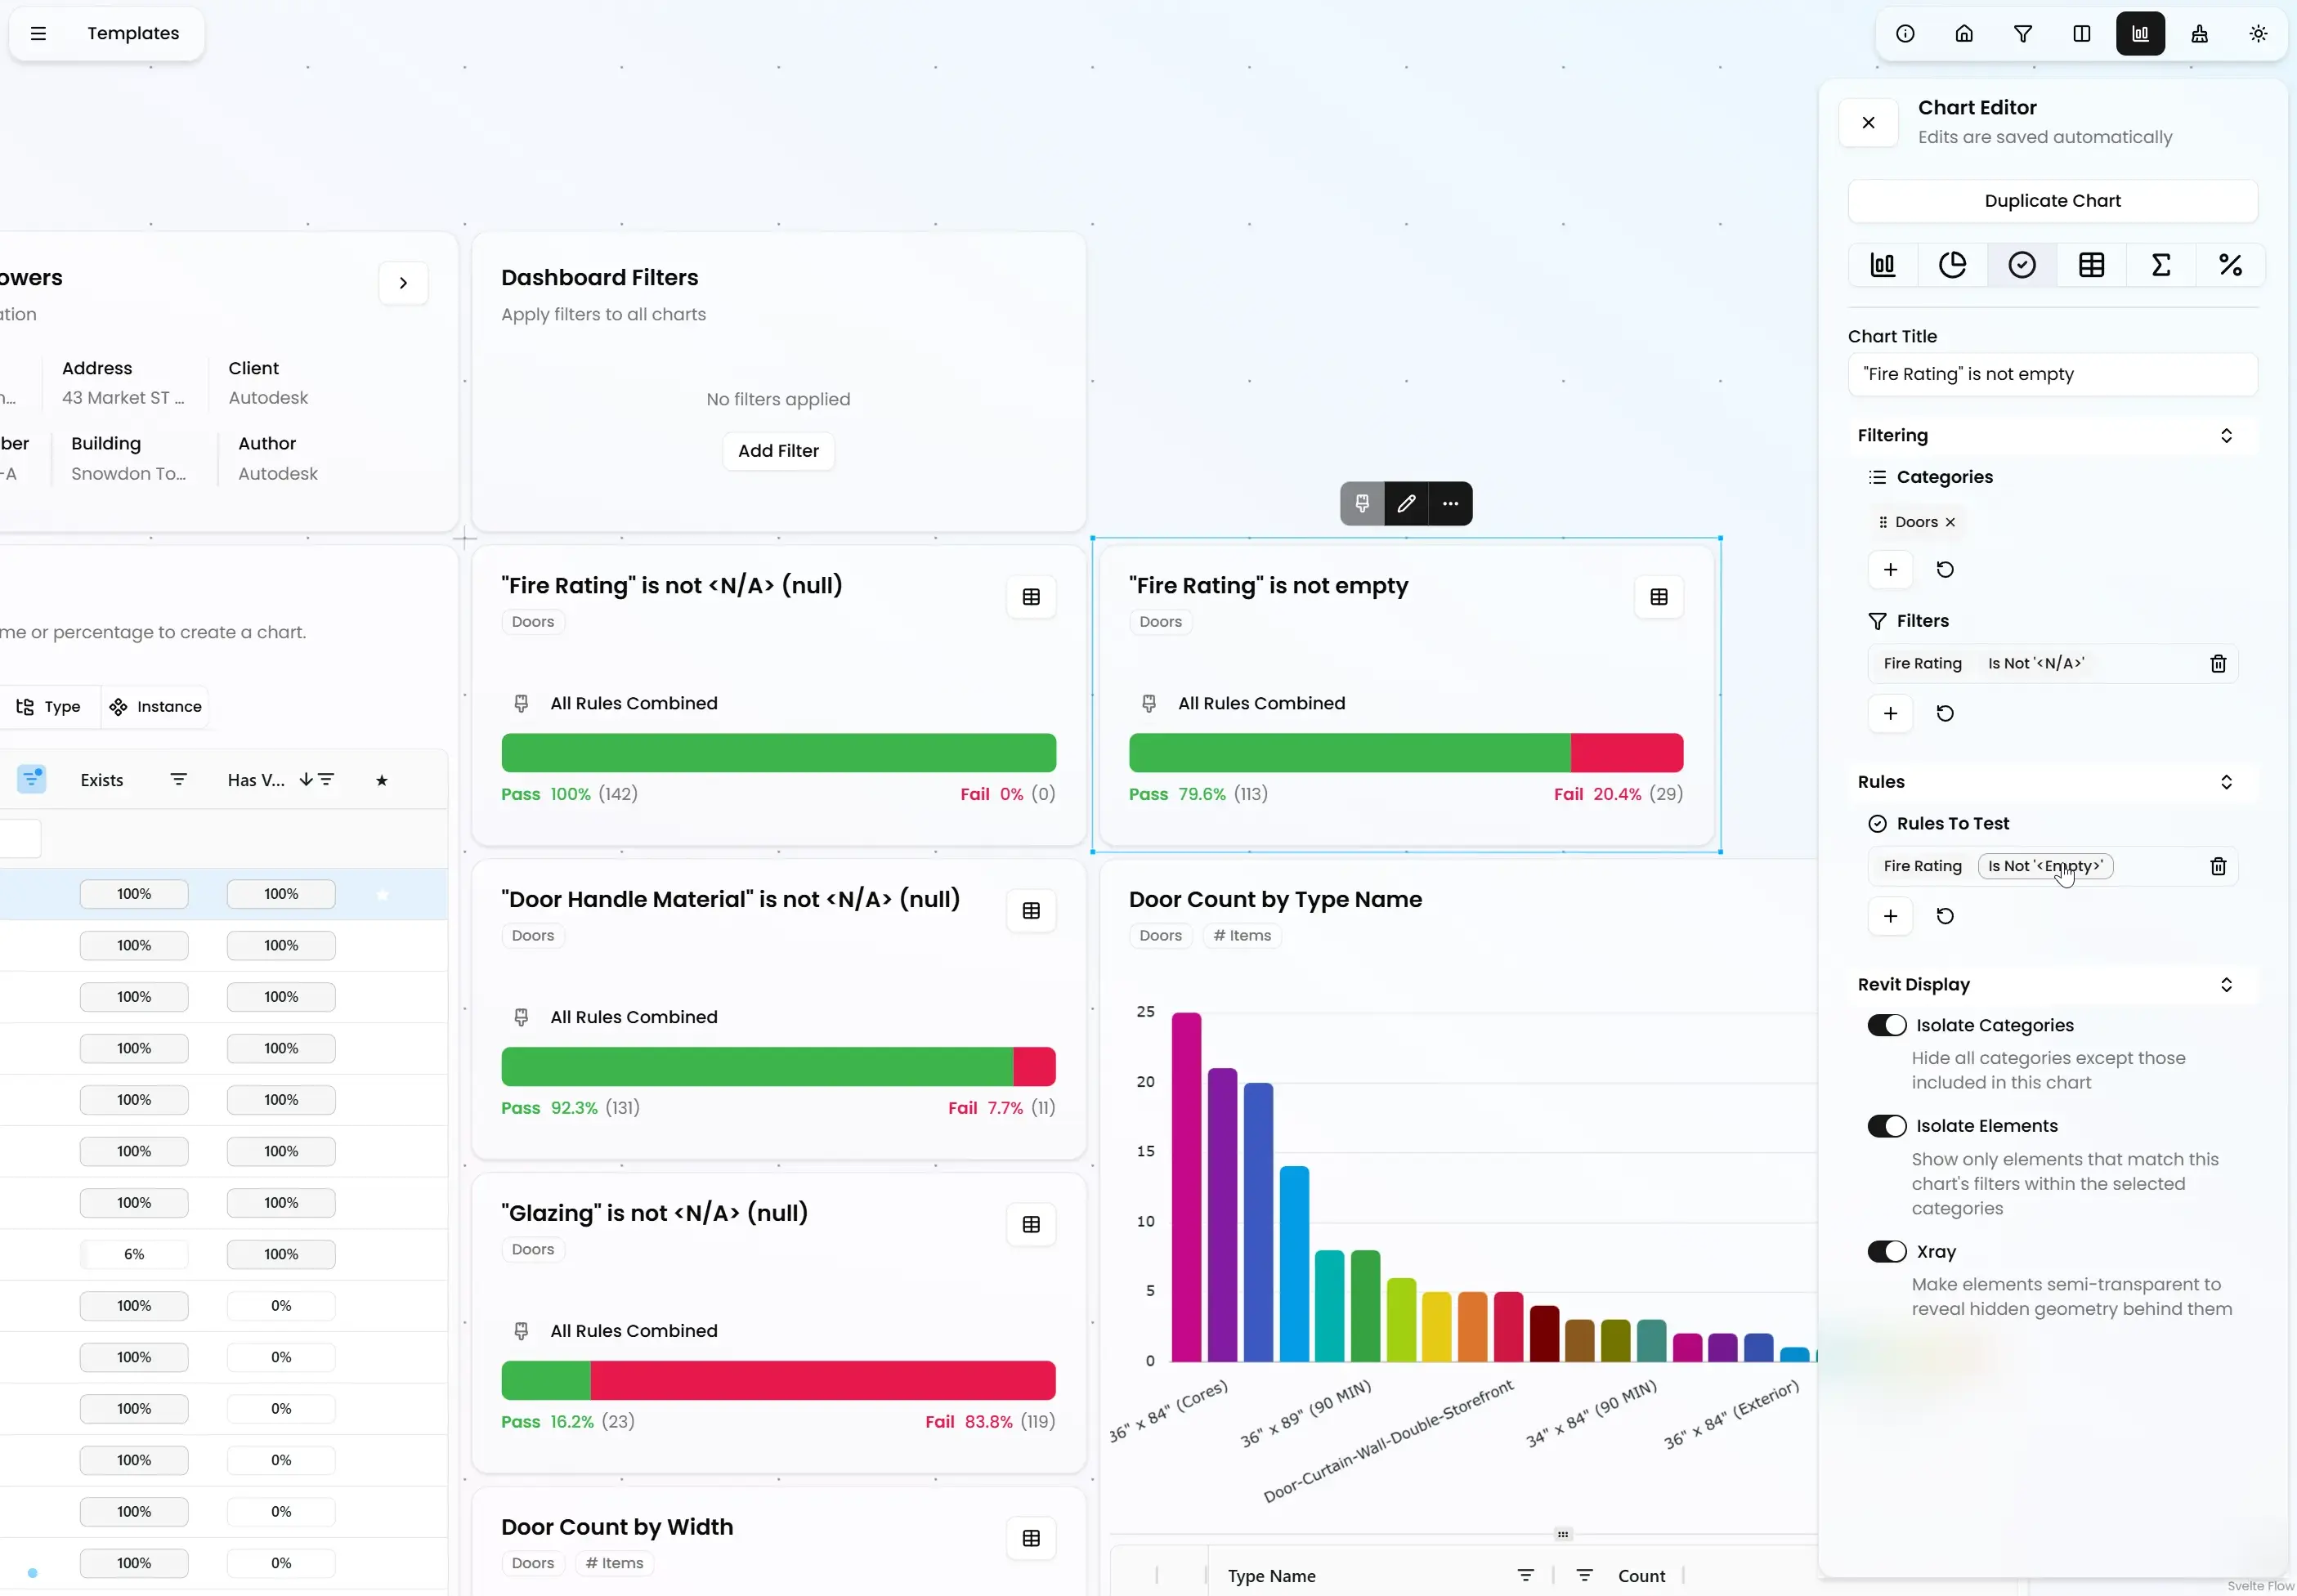
Identify what elements are missing values in a parameter and fix them right away.
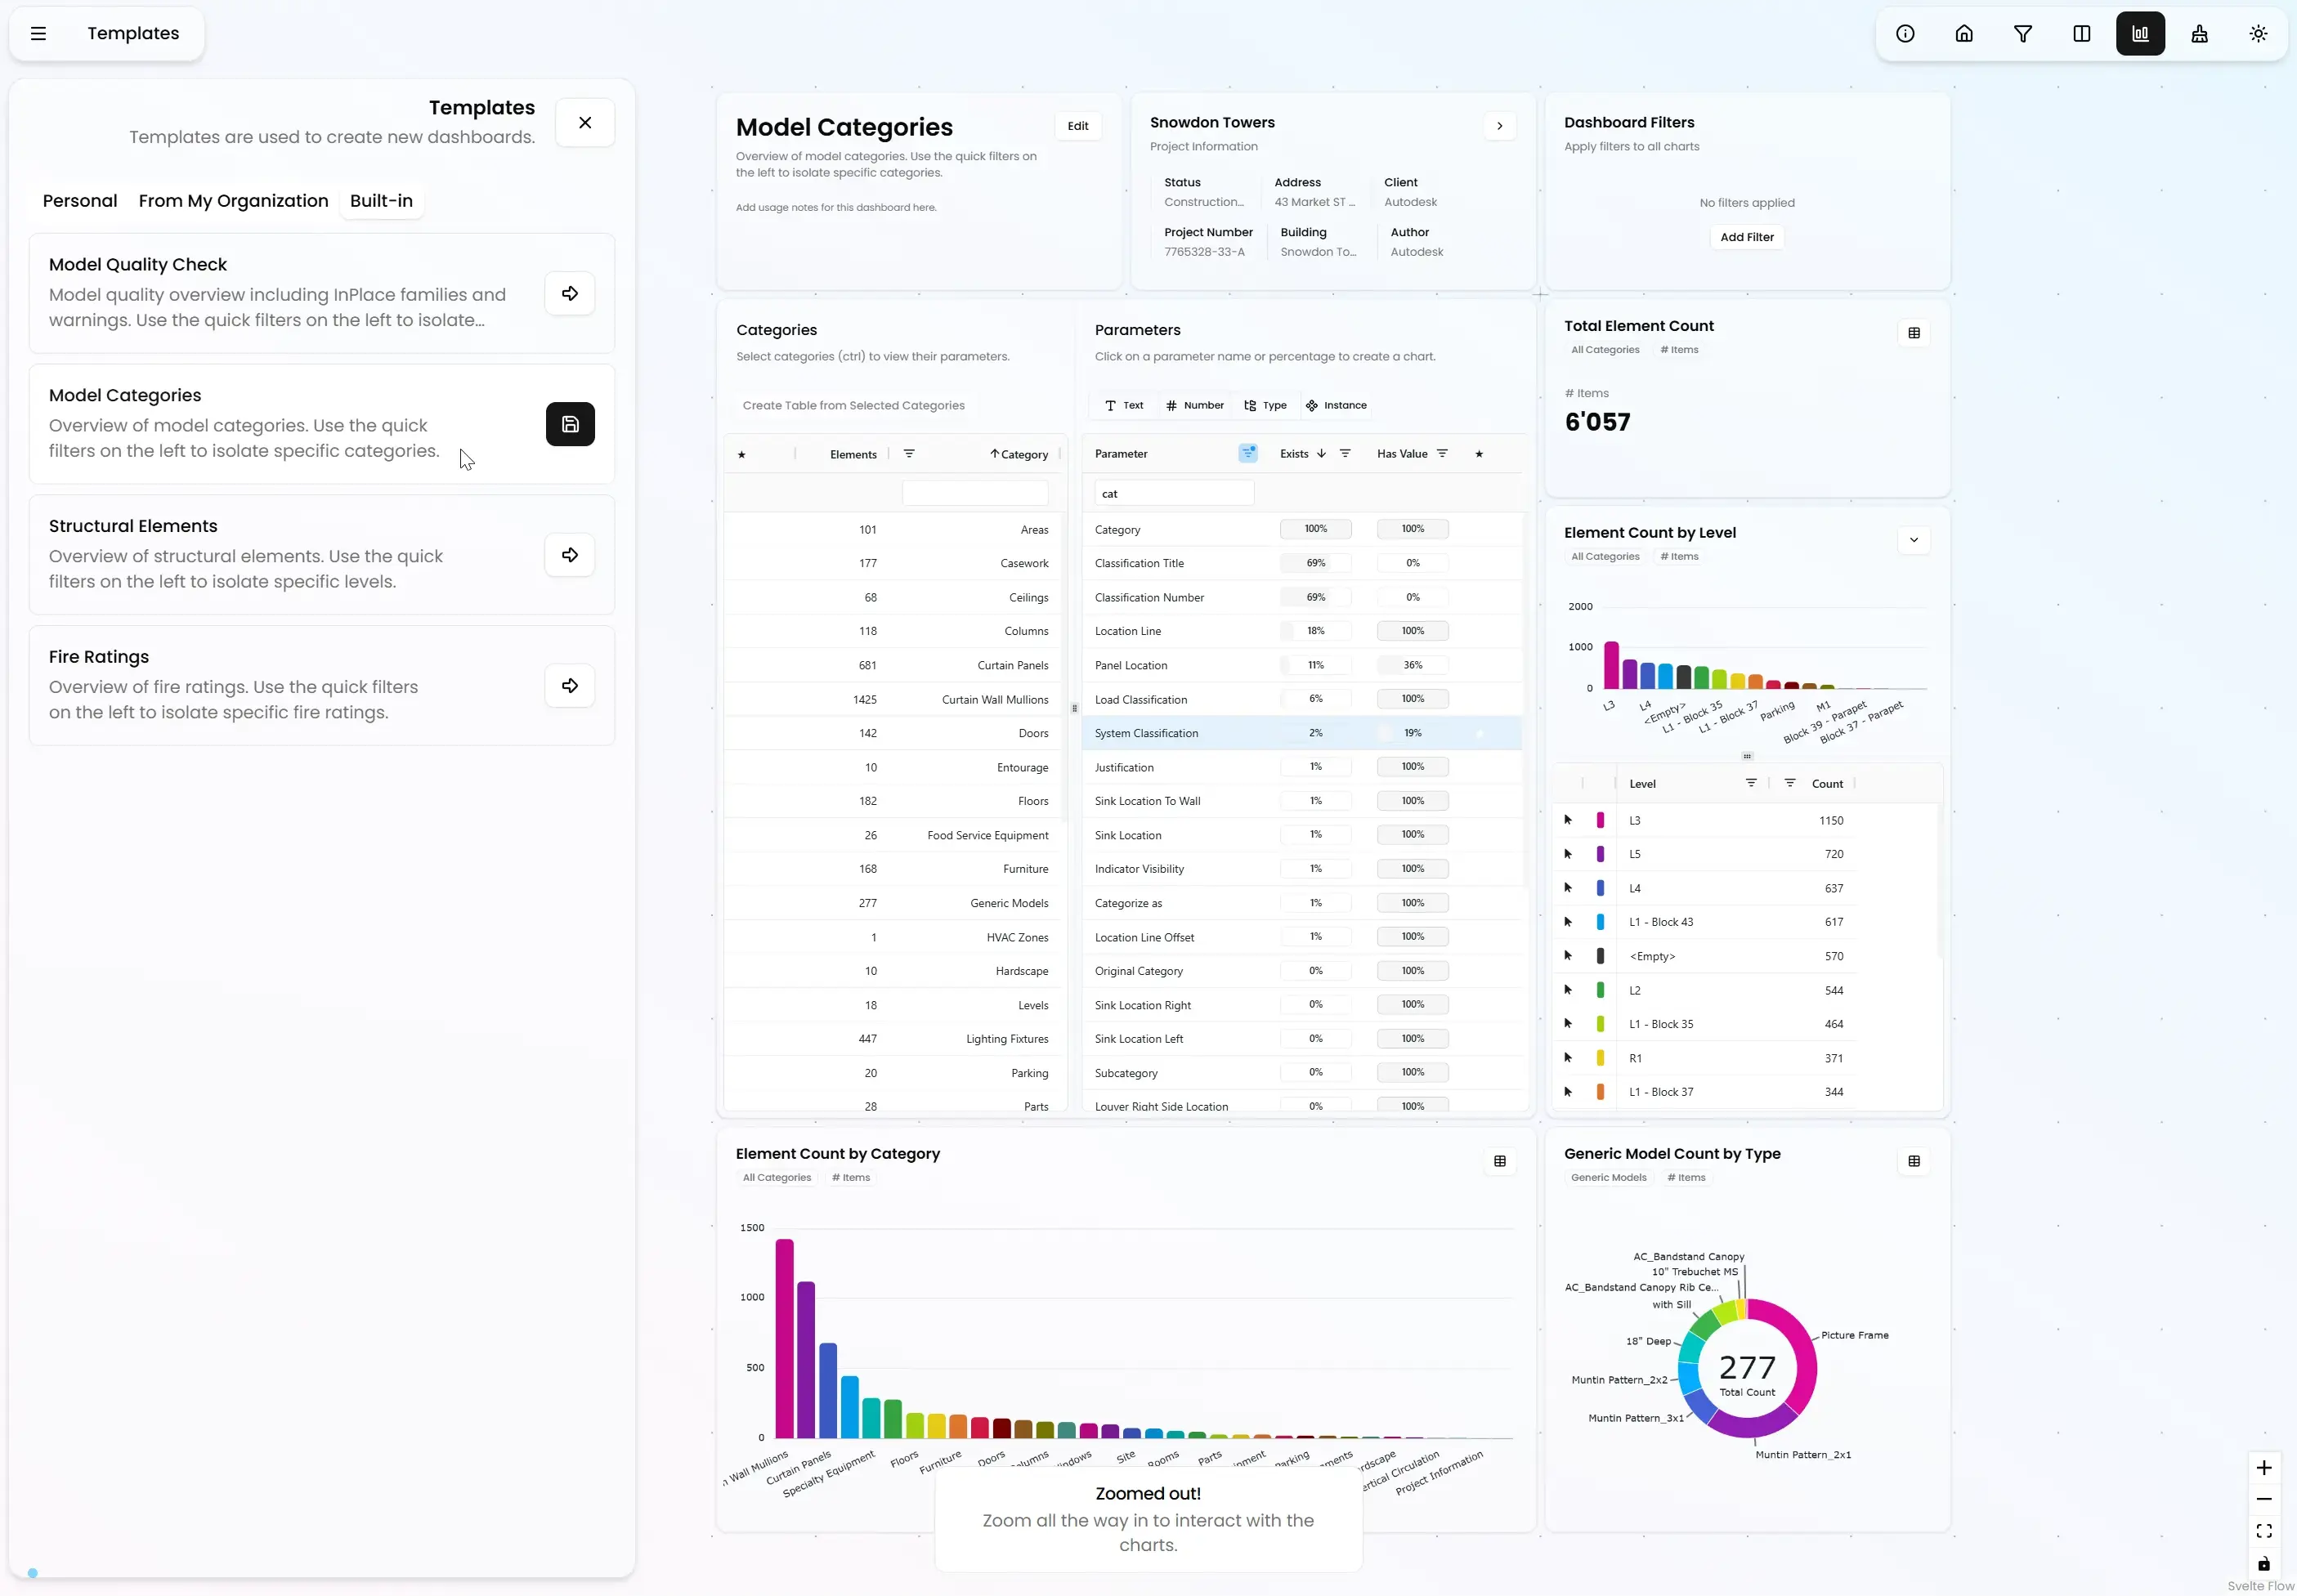
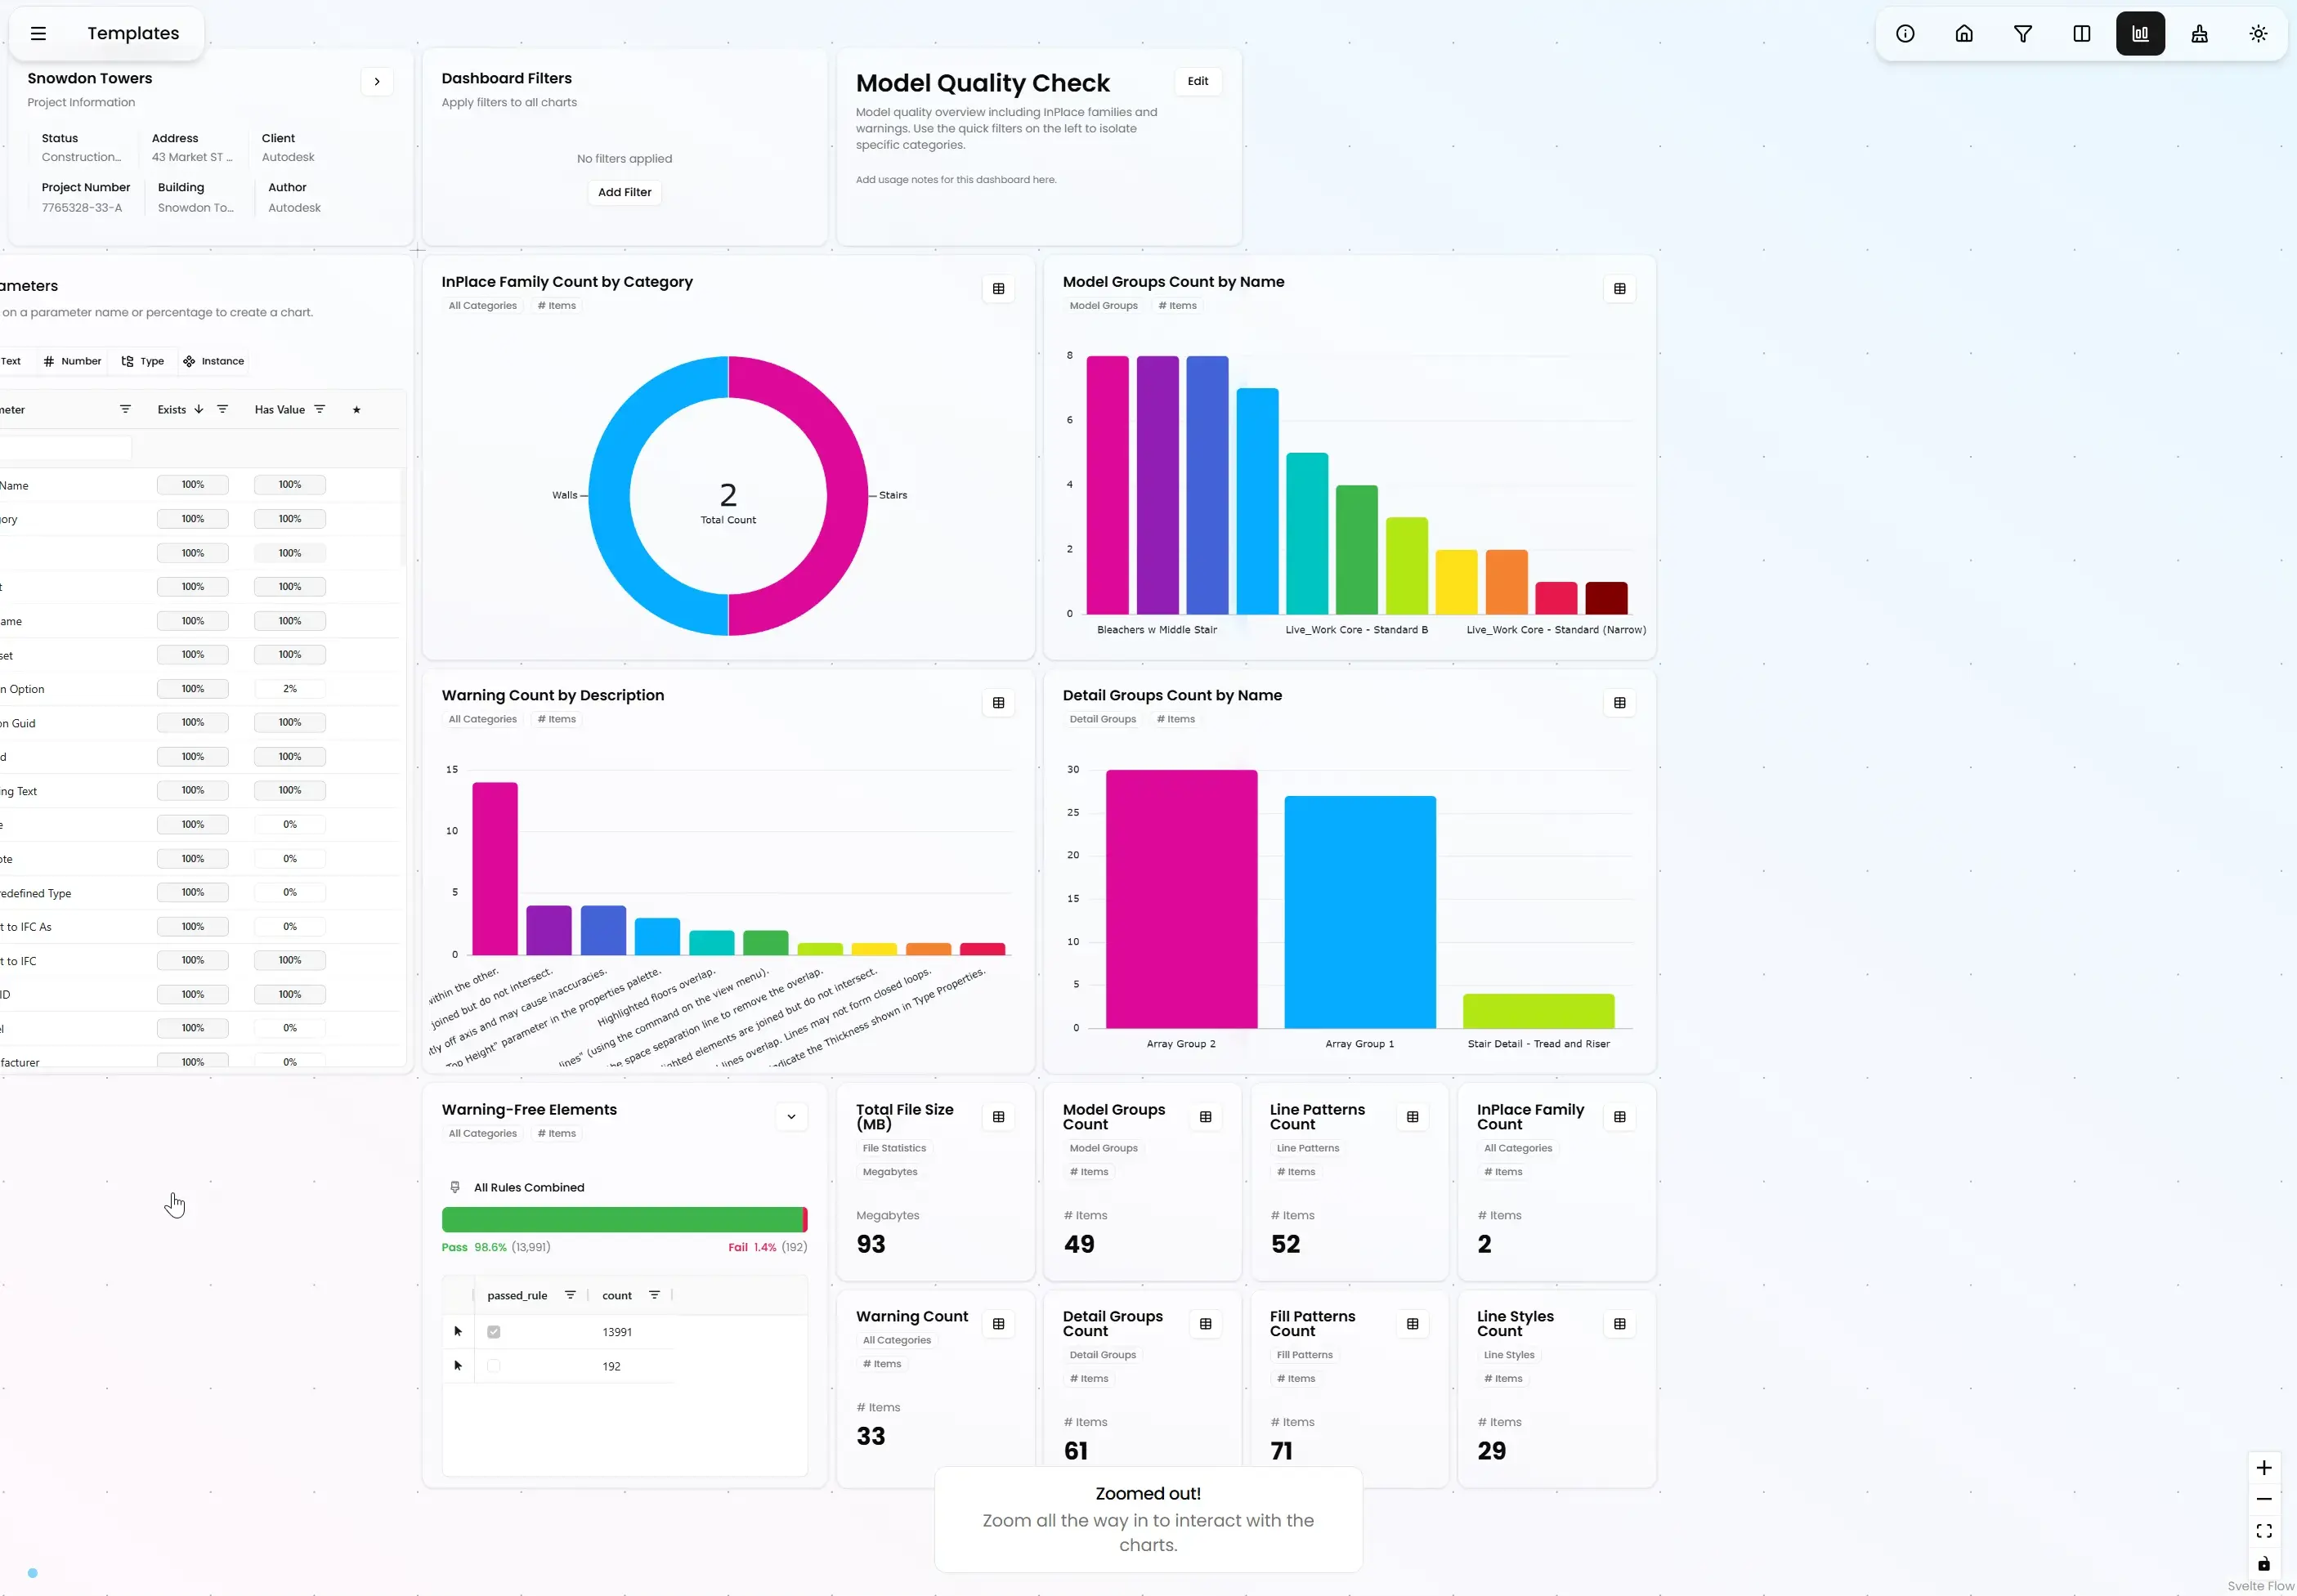
Customize the built-in model health dashboard to your specific needs and save it as a template.
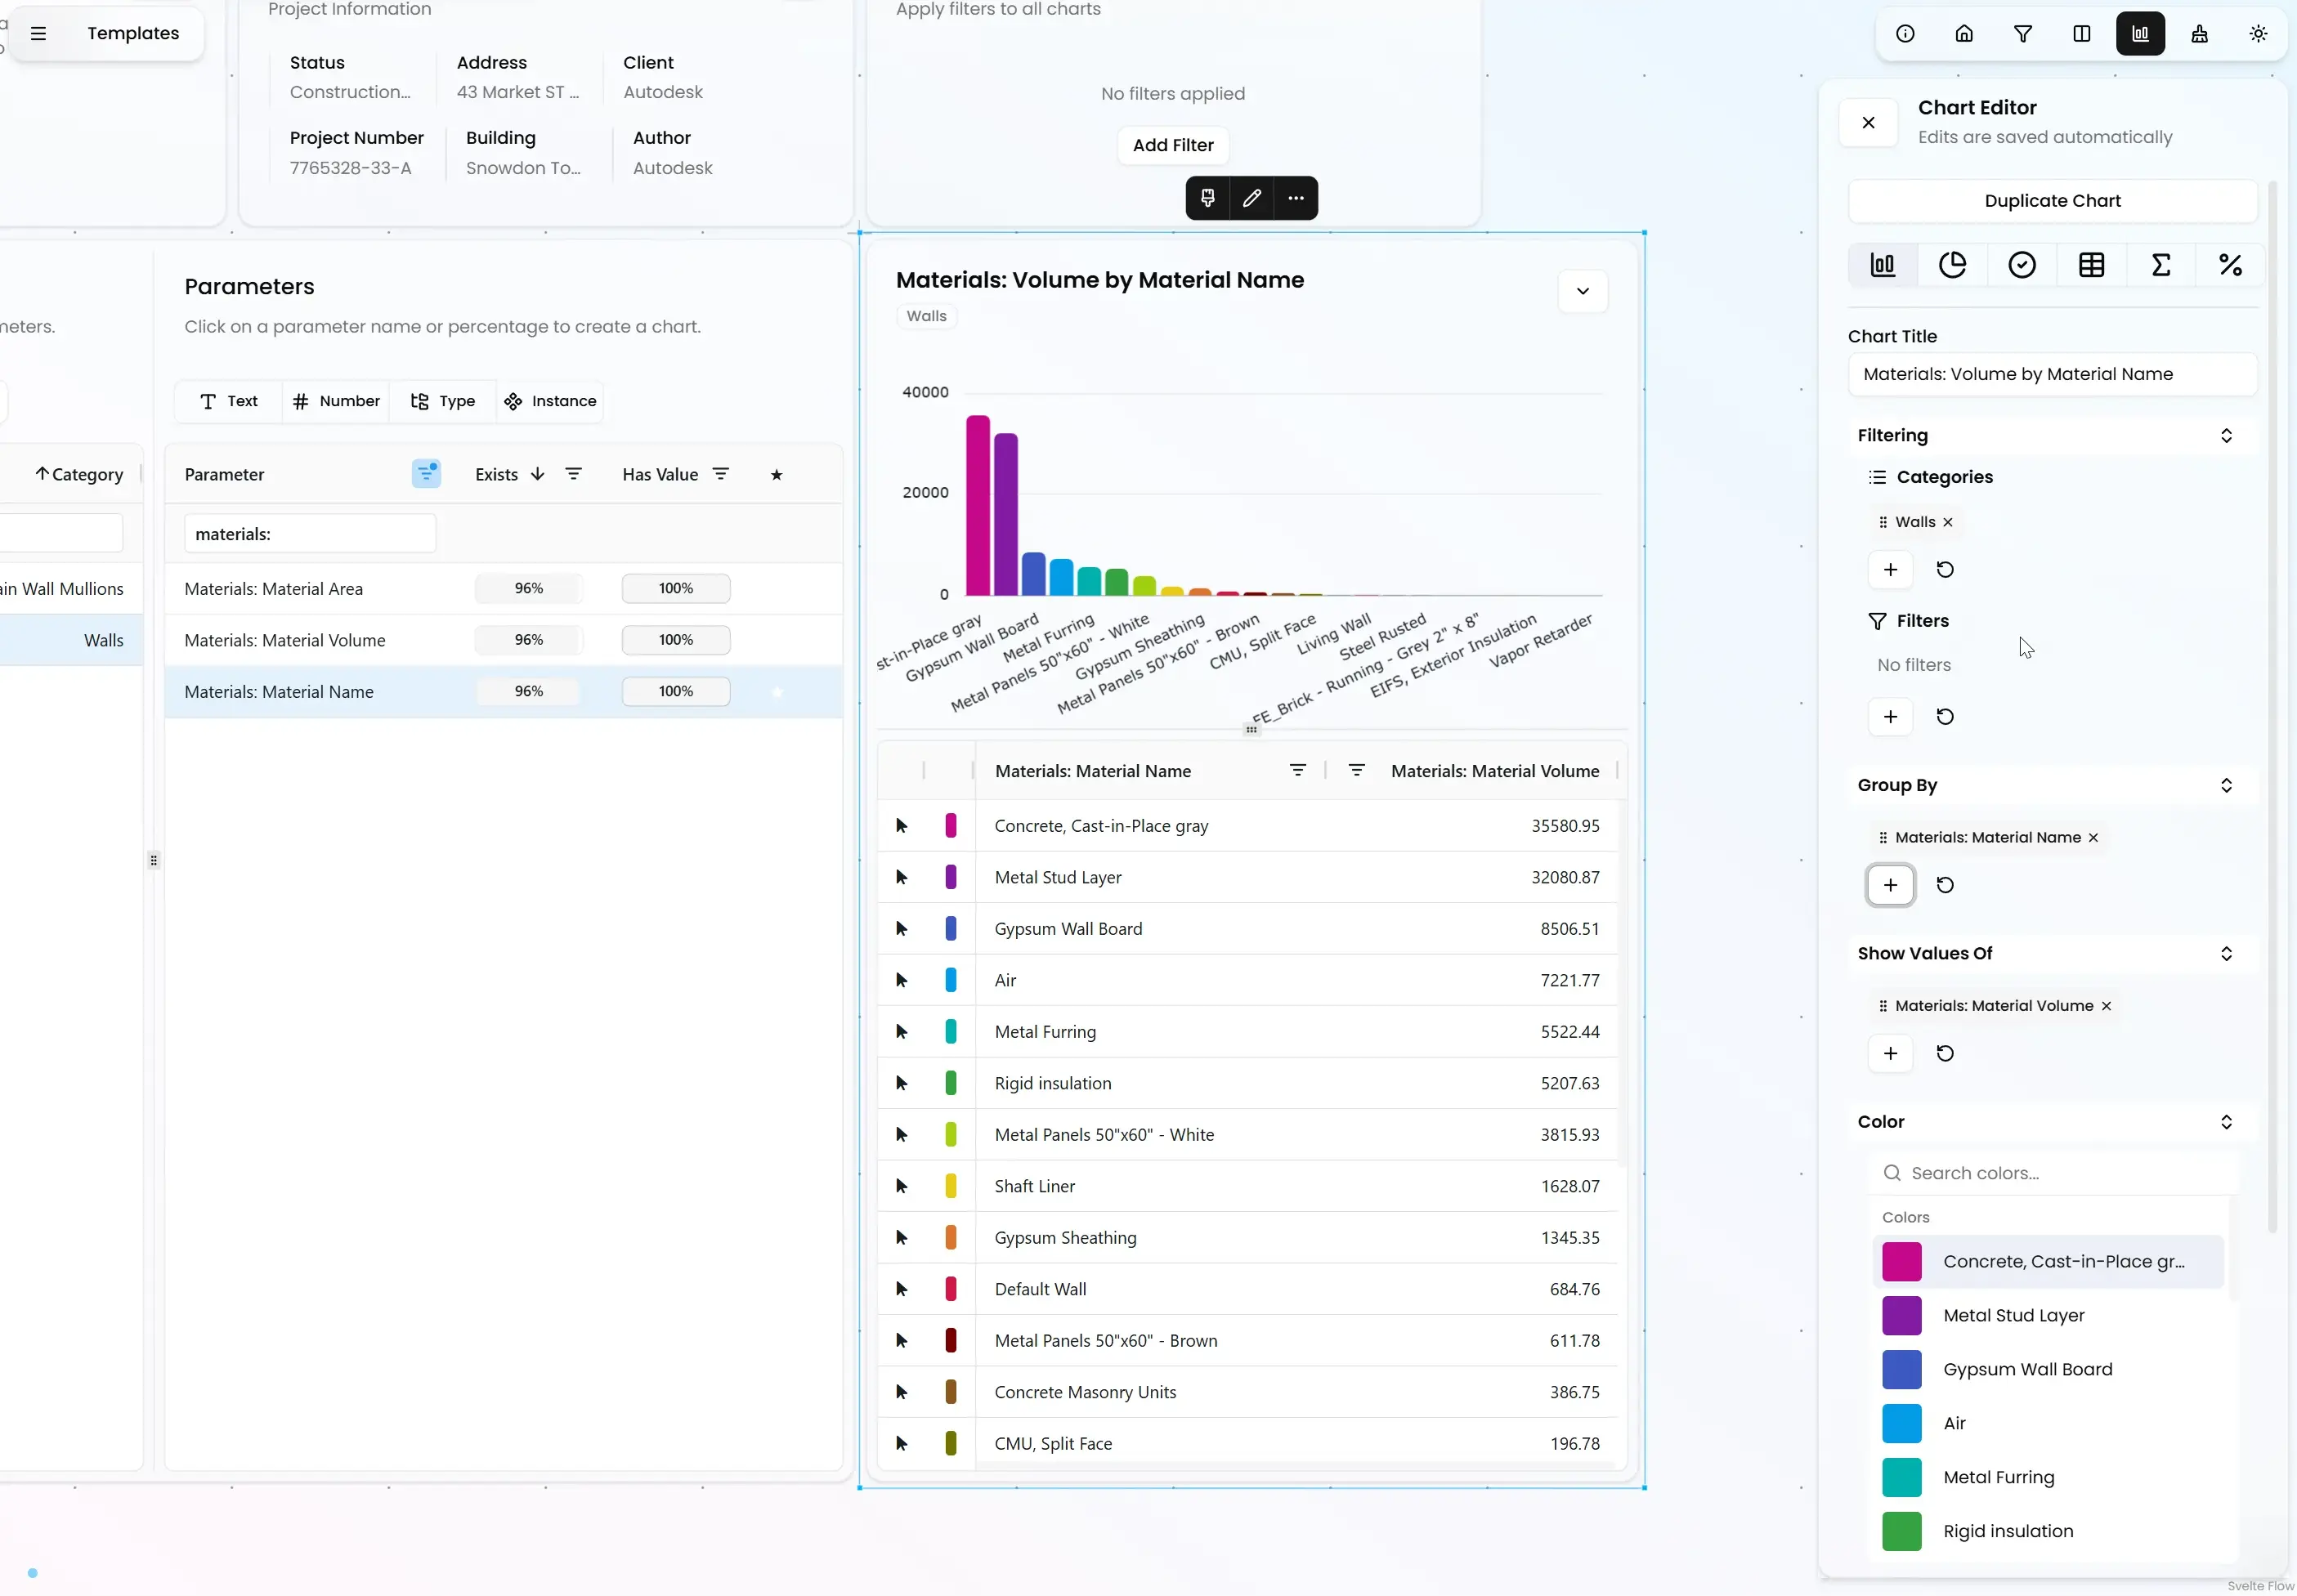
Analyze material area and volume across your model and compare assemblies layer by layer.
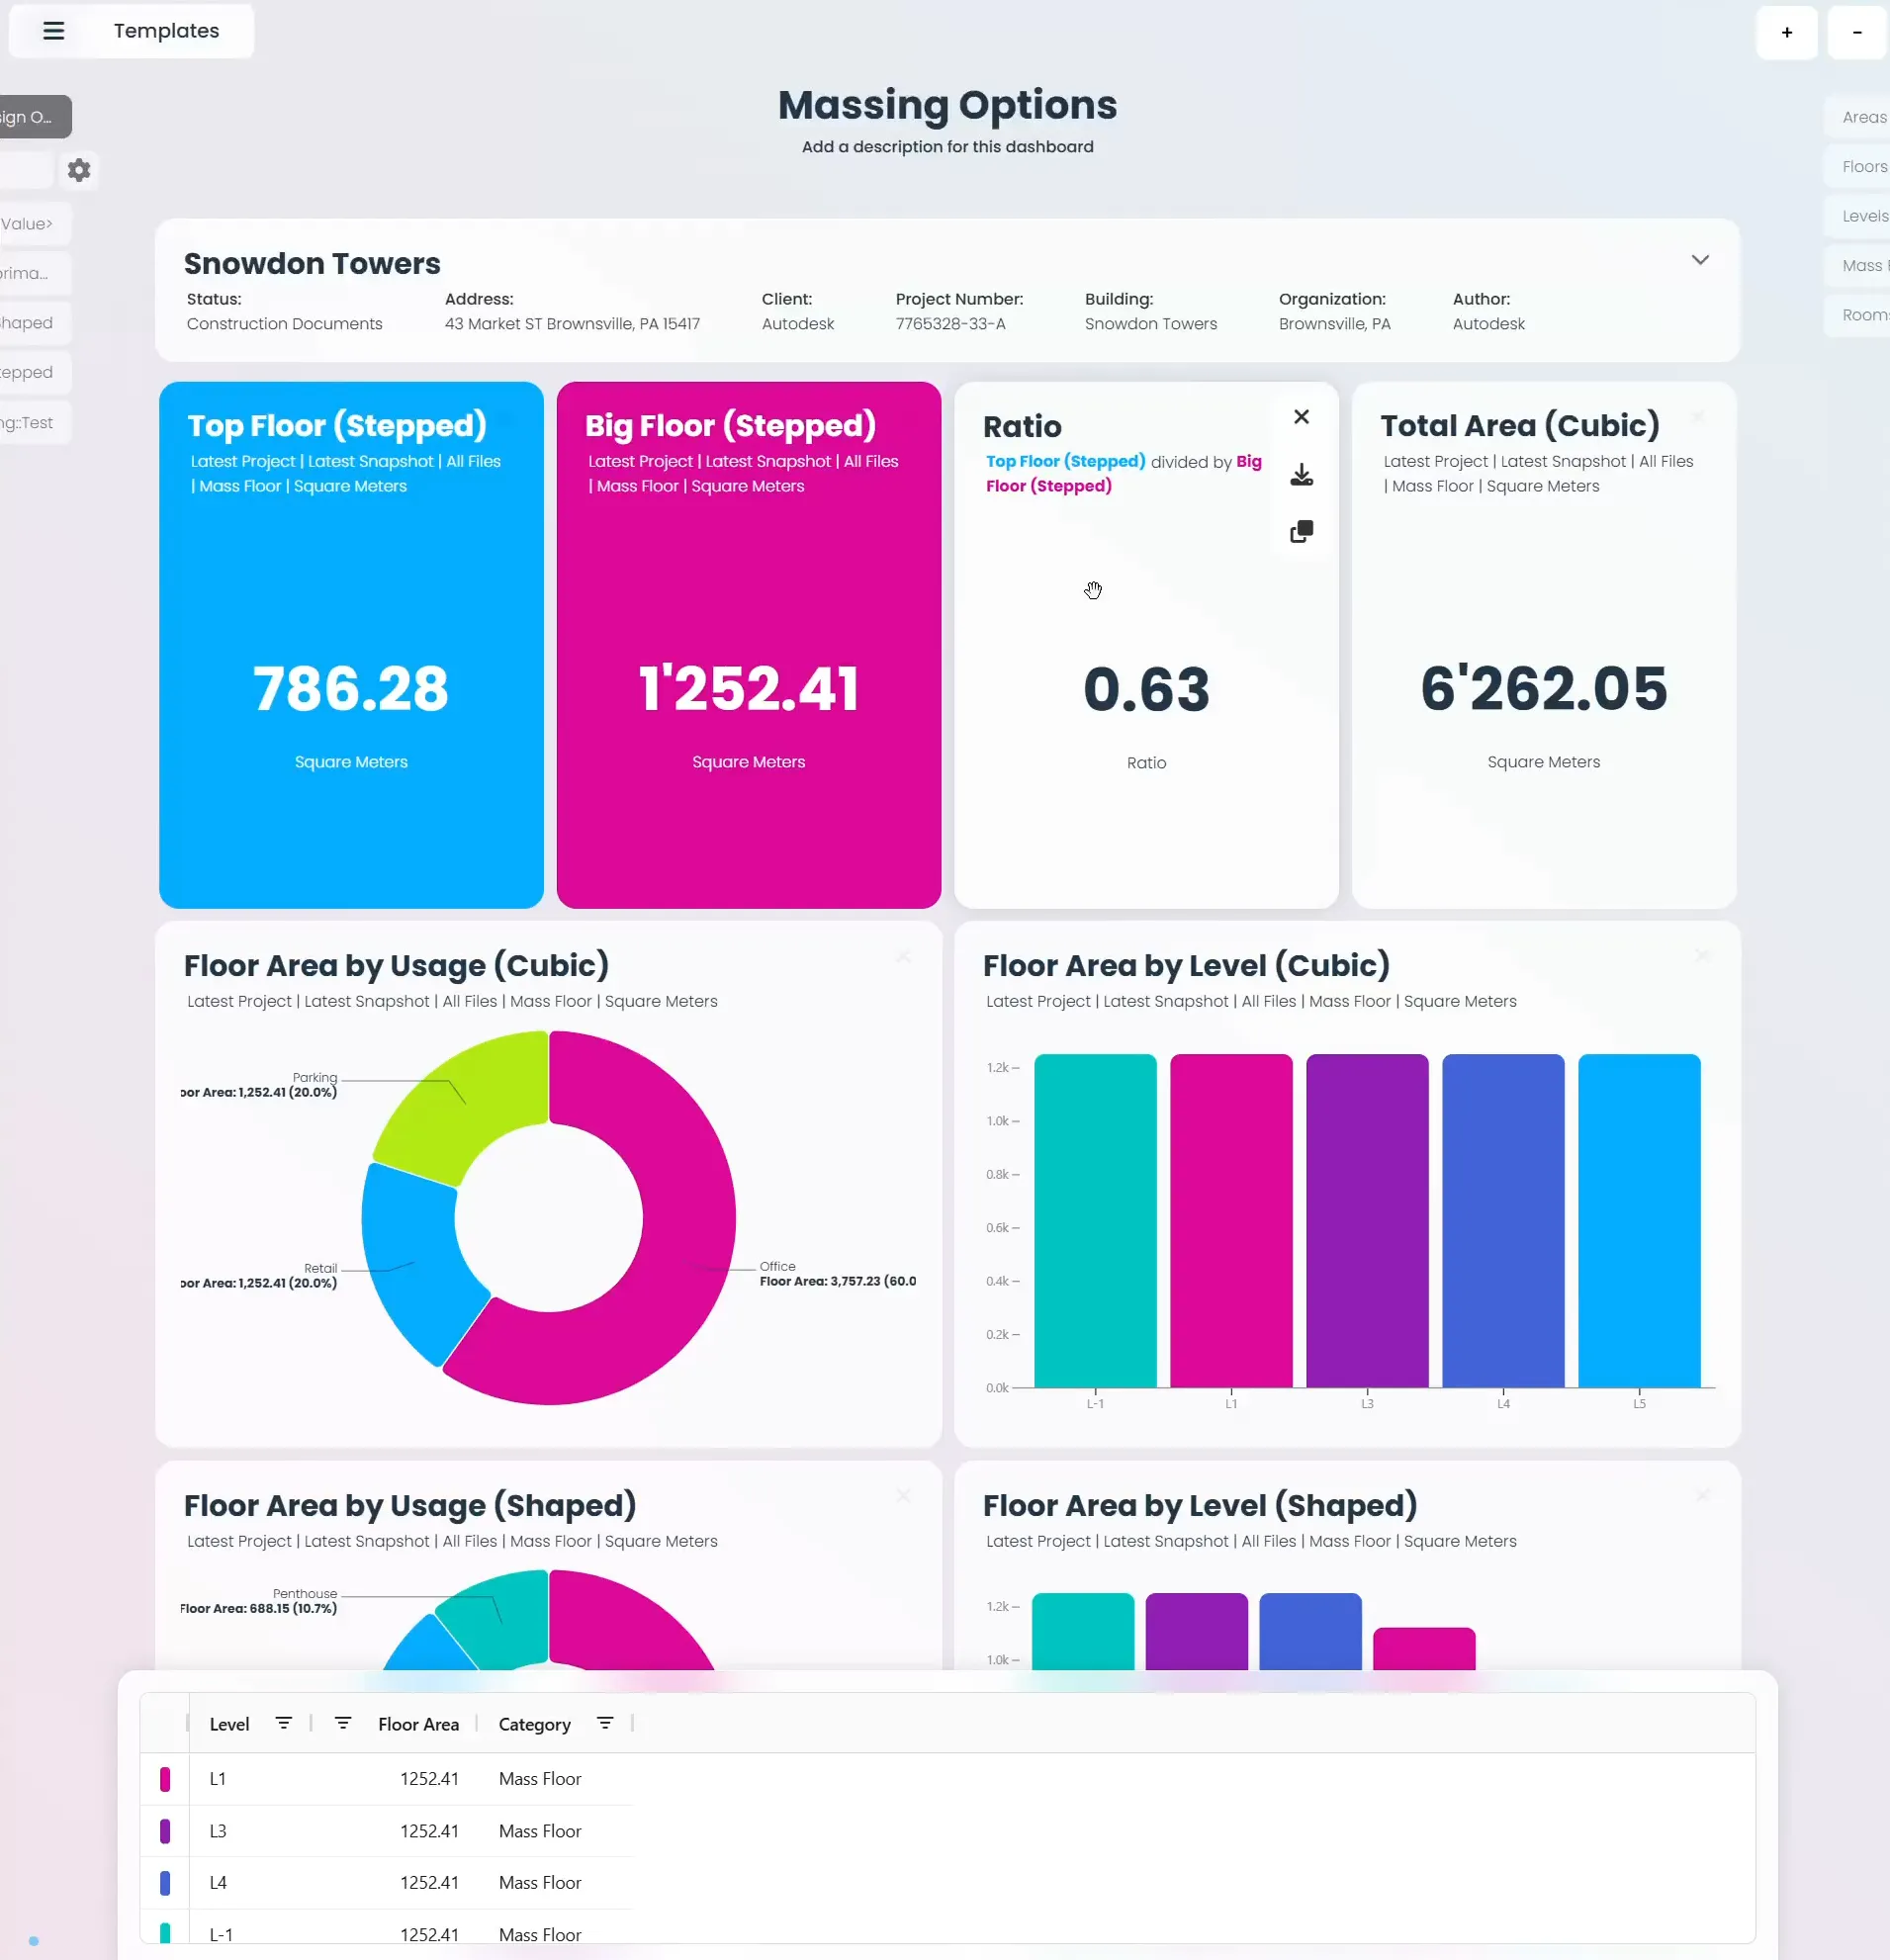
Analyze multiple design alternatives with comprehensive dashboards showing floor areas, usage distributions, and ratios across different options.
Made for all AEC professionals.
From architects to structural engineers to MEP designers.
Walls, beams and ducts - they all have parameters.
That's why Vyssuals works for everyone.
Architects
Streamline your design process with real-time room and area analysis.
Manage door schedules like it's a piece of cake.
This is your Enscape for data.
Structural Engineers
Achieve perfect precision efficiently. Monitor column and beam properties, track structural parameters, and ensure load-bearing elements meet specifications across all project phases.
MEP Designers
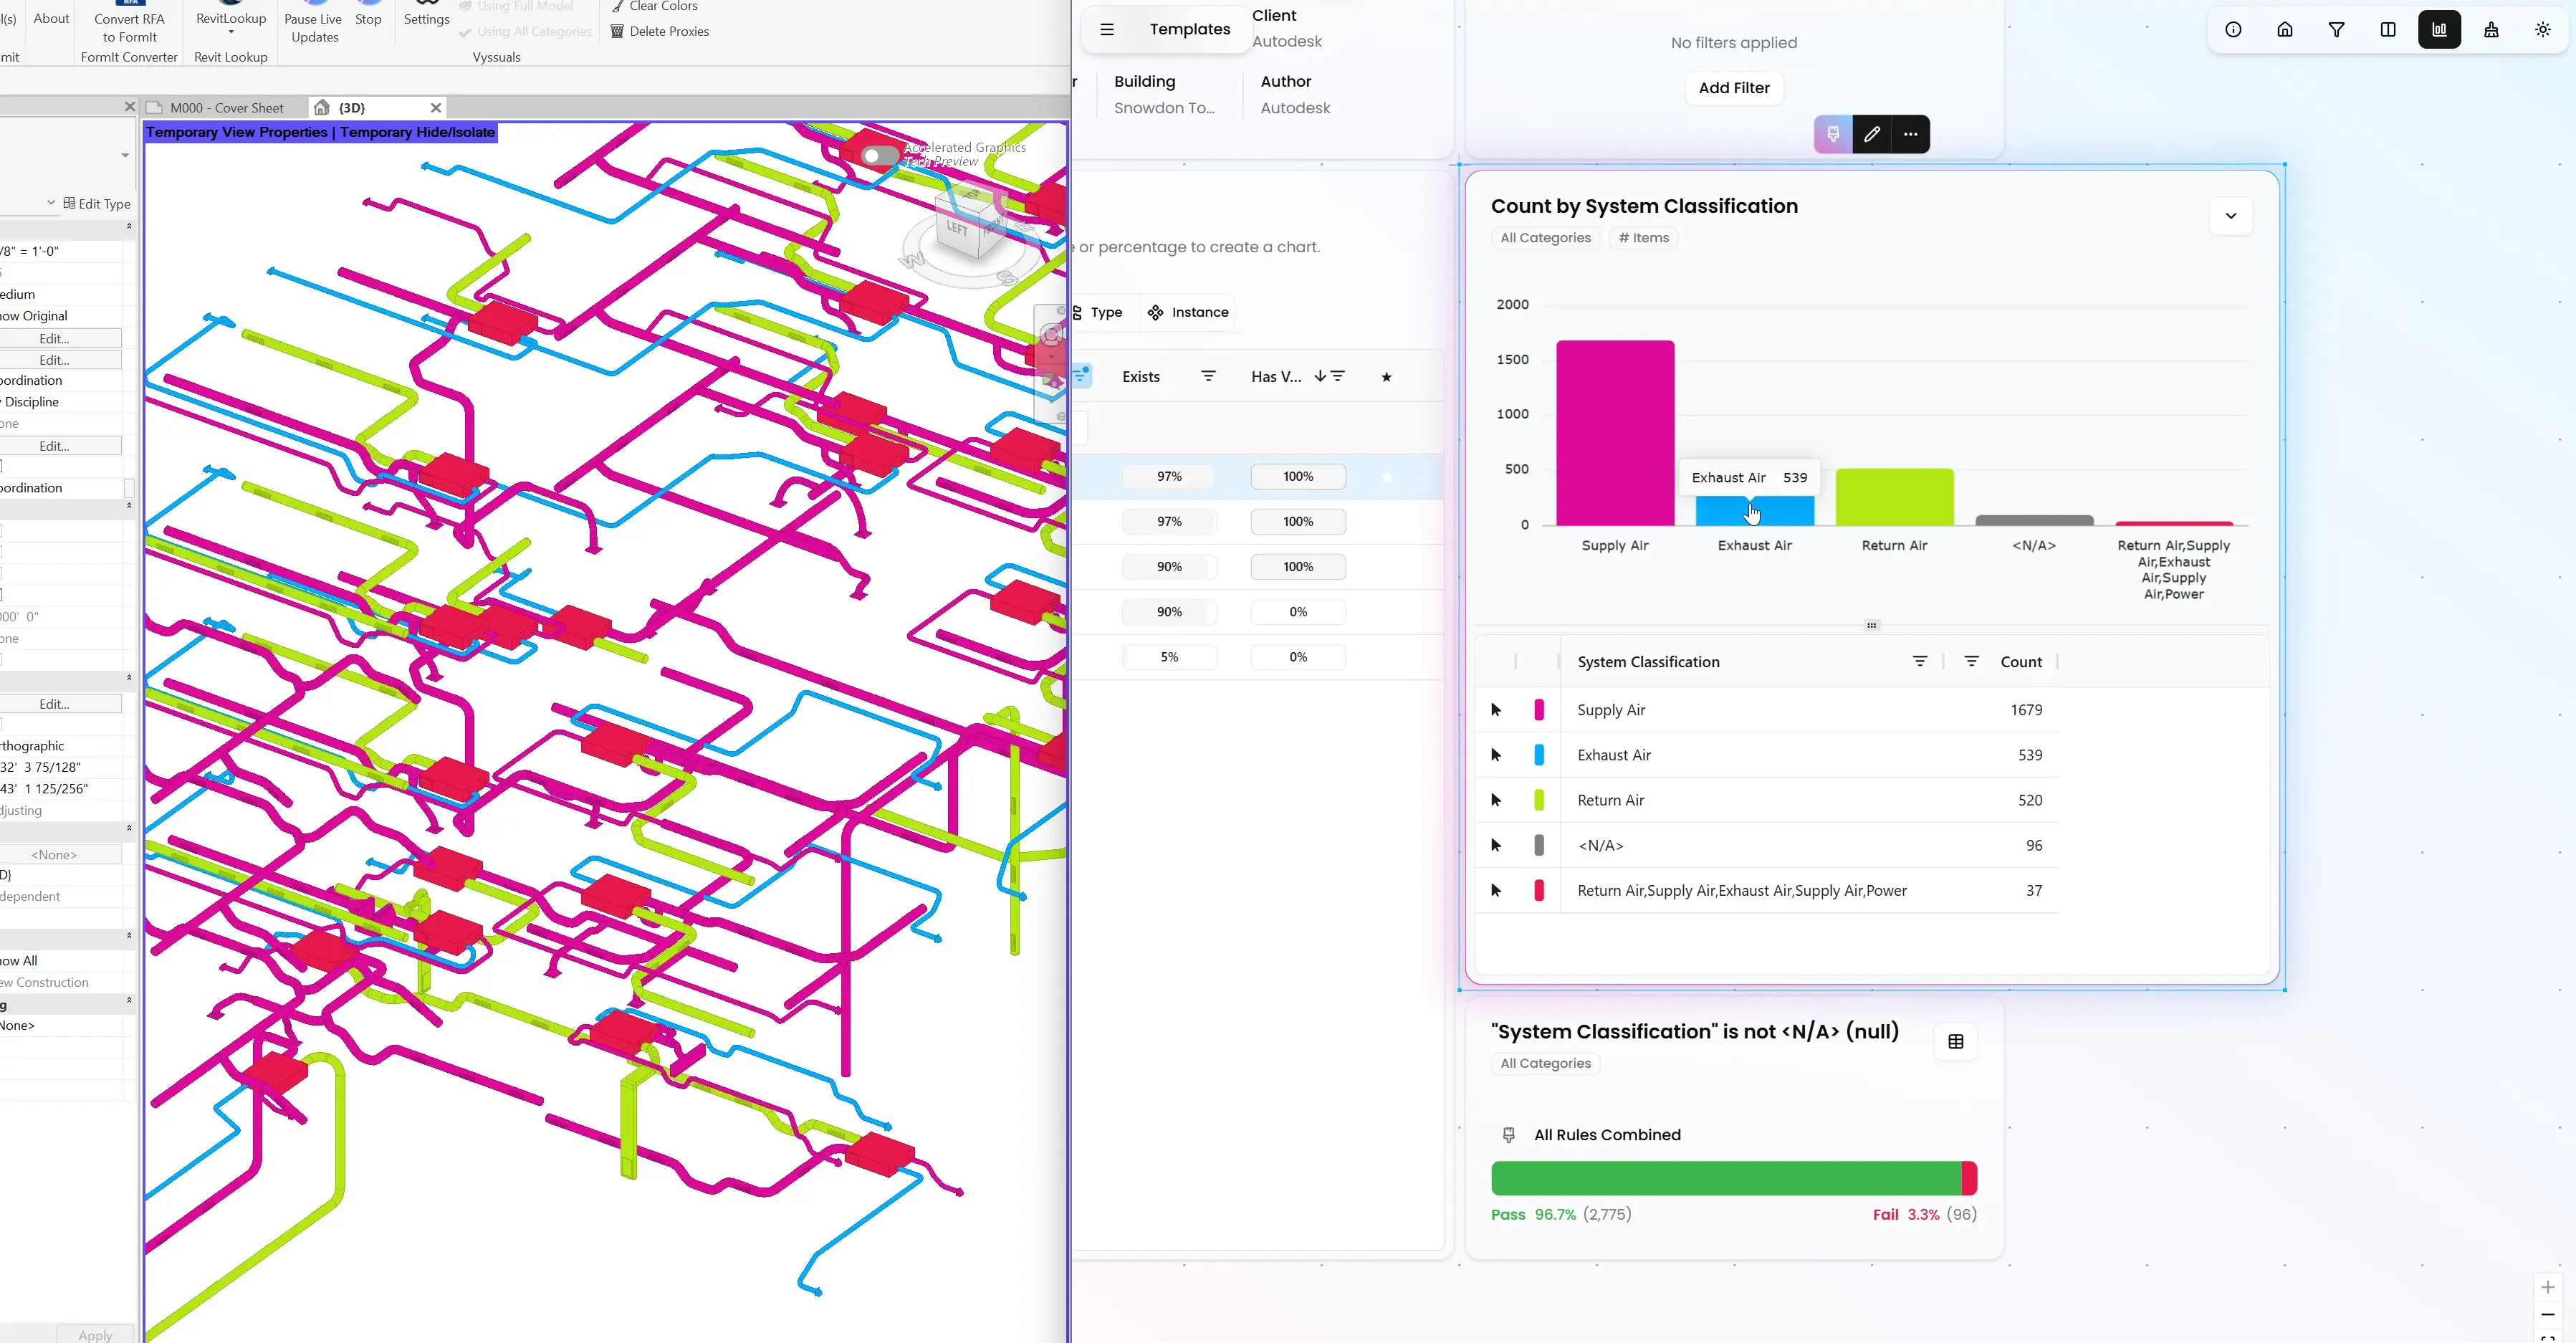
Enhance your mechanical, electrical, and plumbing coordination with system-wide parameter monitoring. Track equipment specifications, monitor system performance, and ensure MEP elements are properly coordinated with architectural and structural elements.
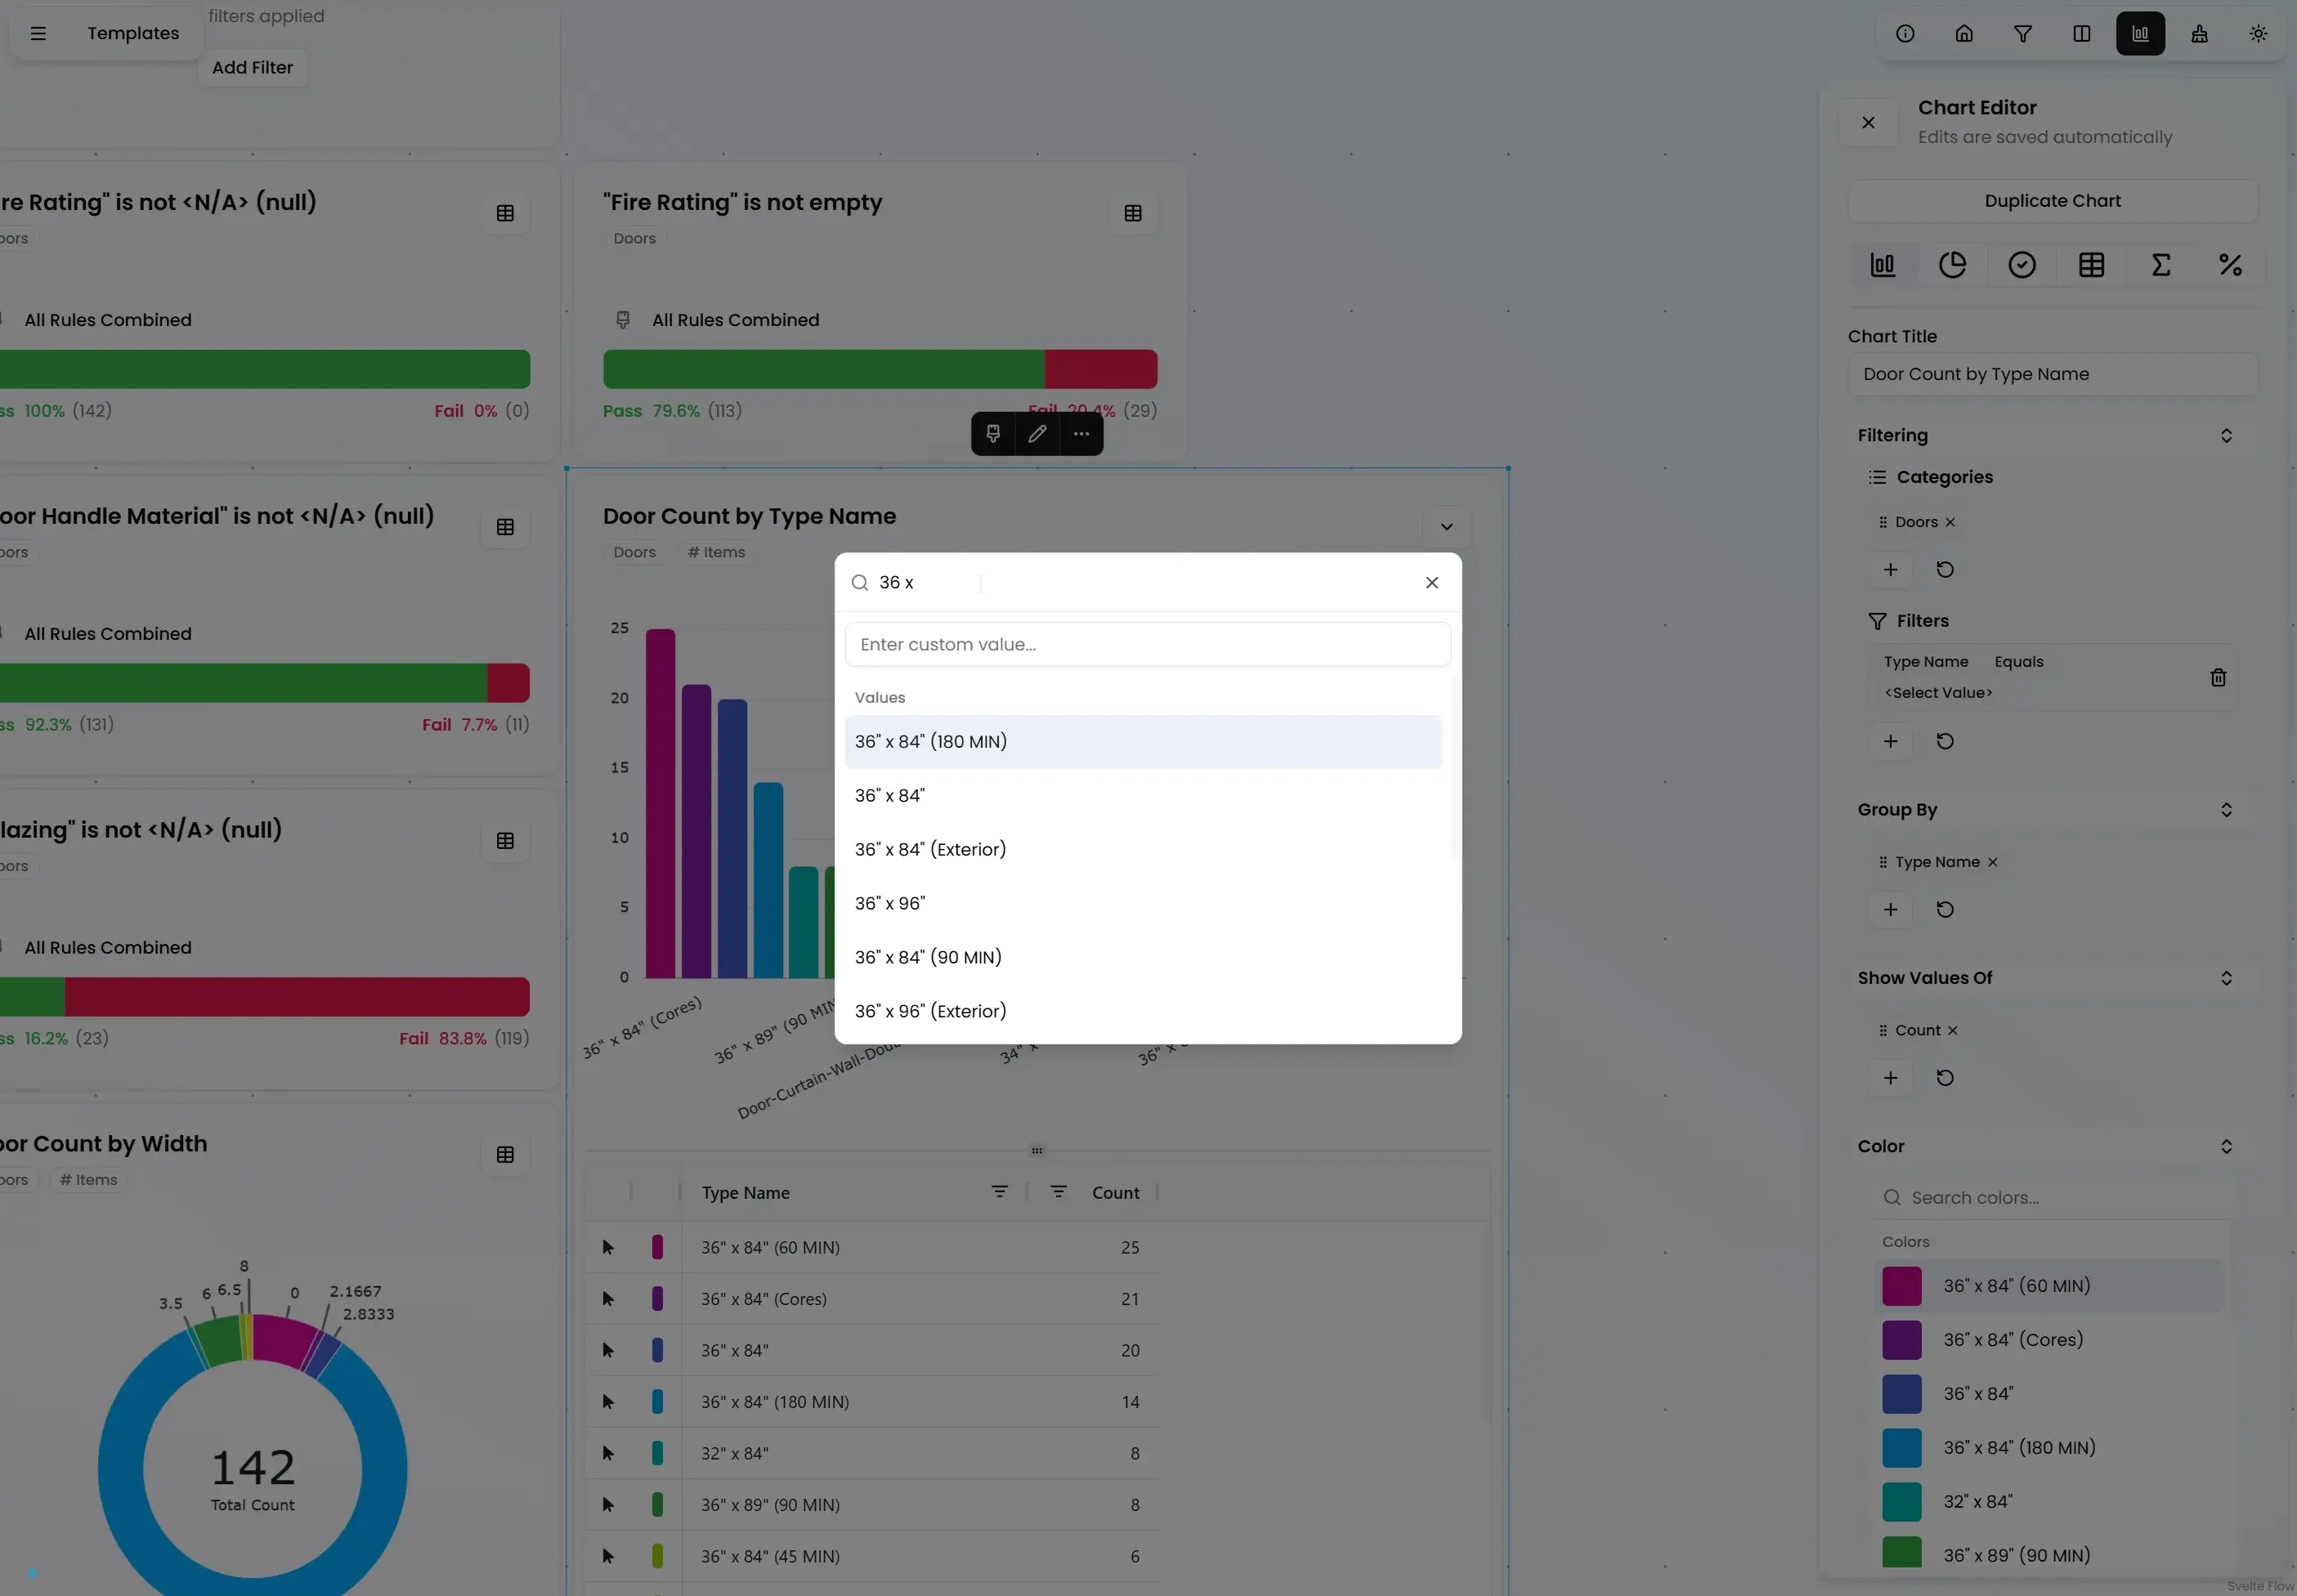
Fully customizable charts.
Adjust any chart in the Chart Editor to show exactly what you need to see.
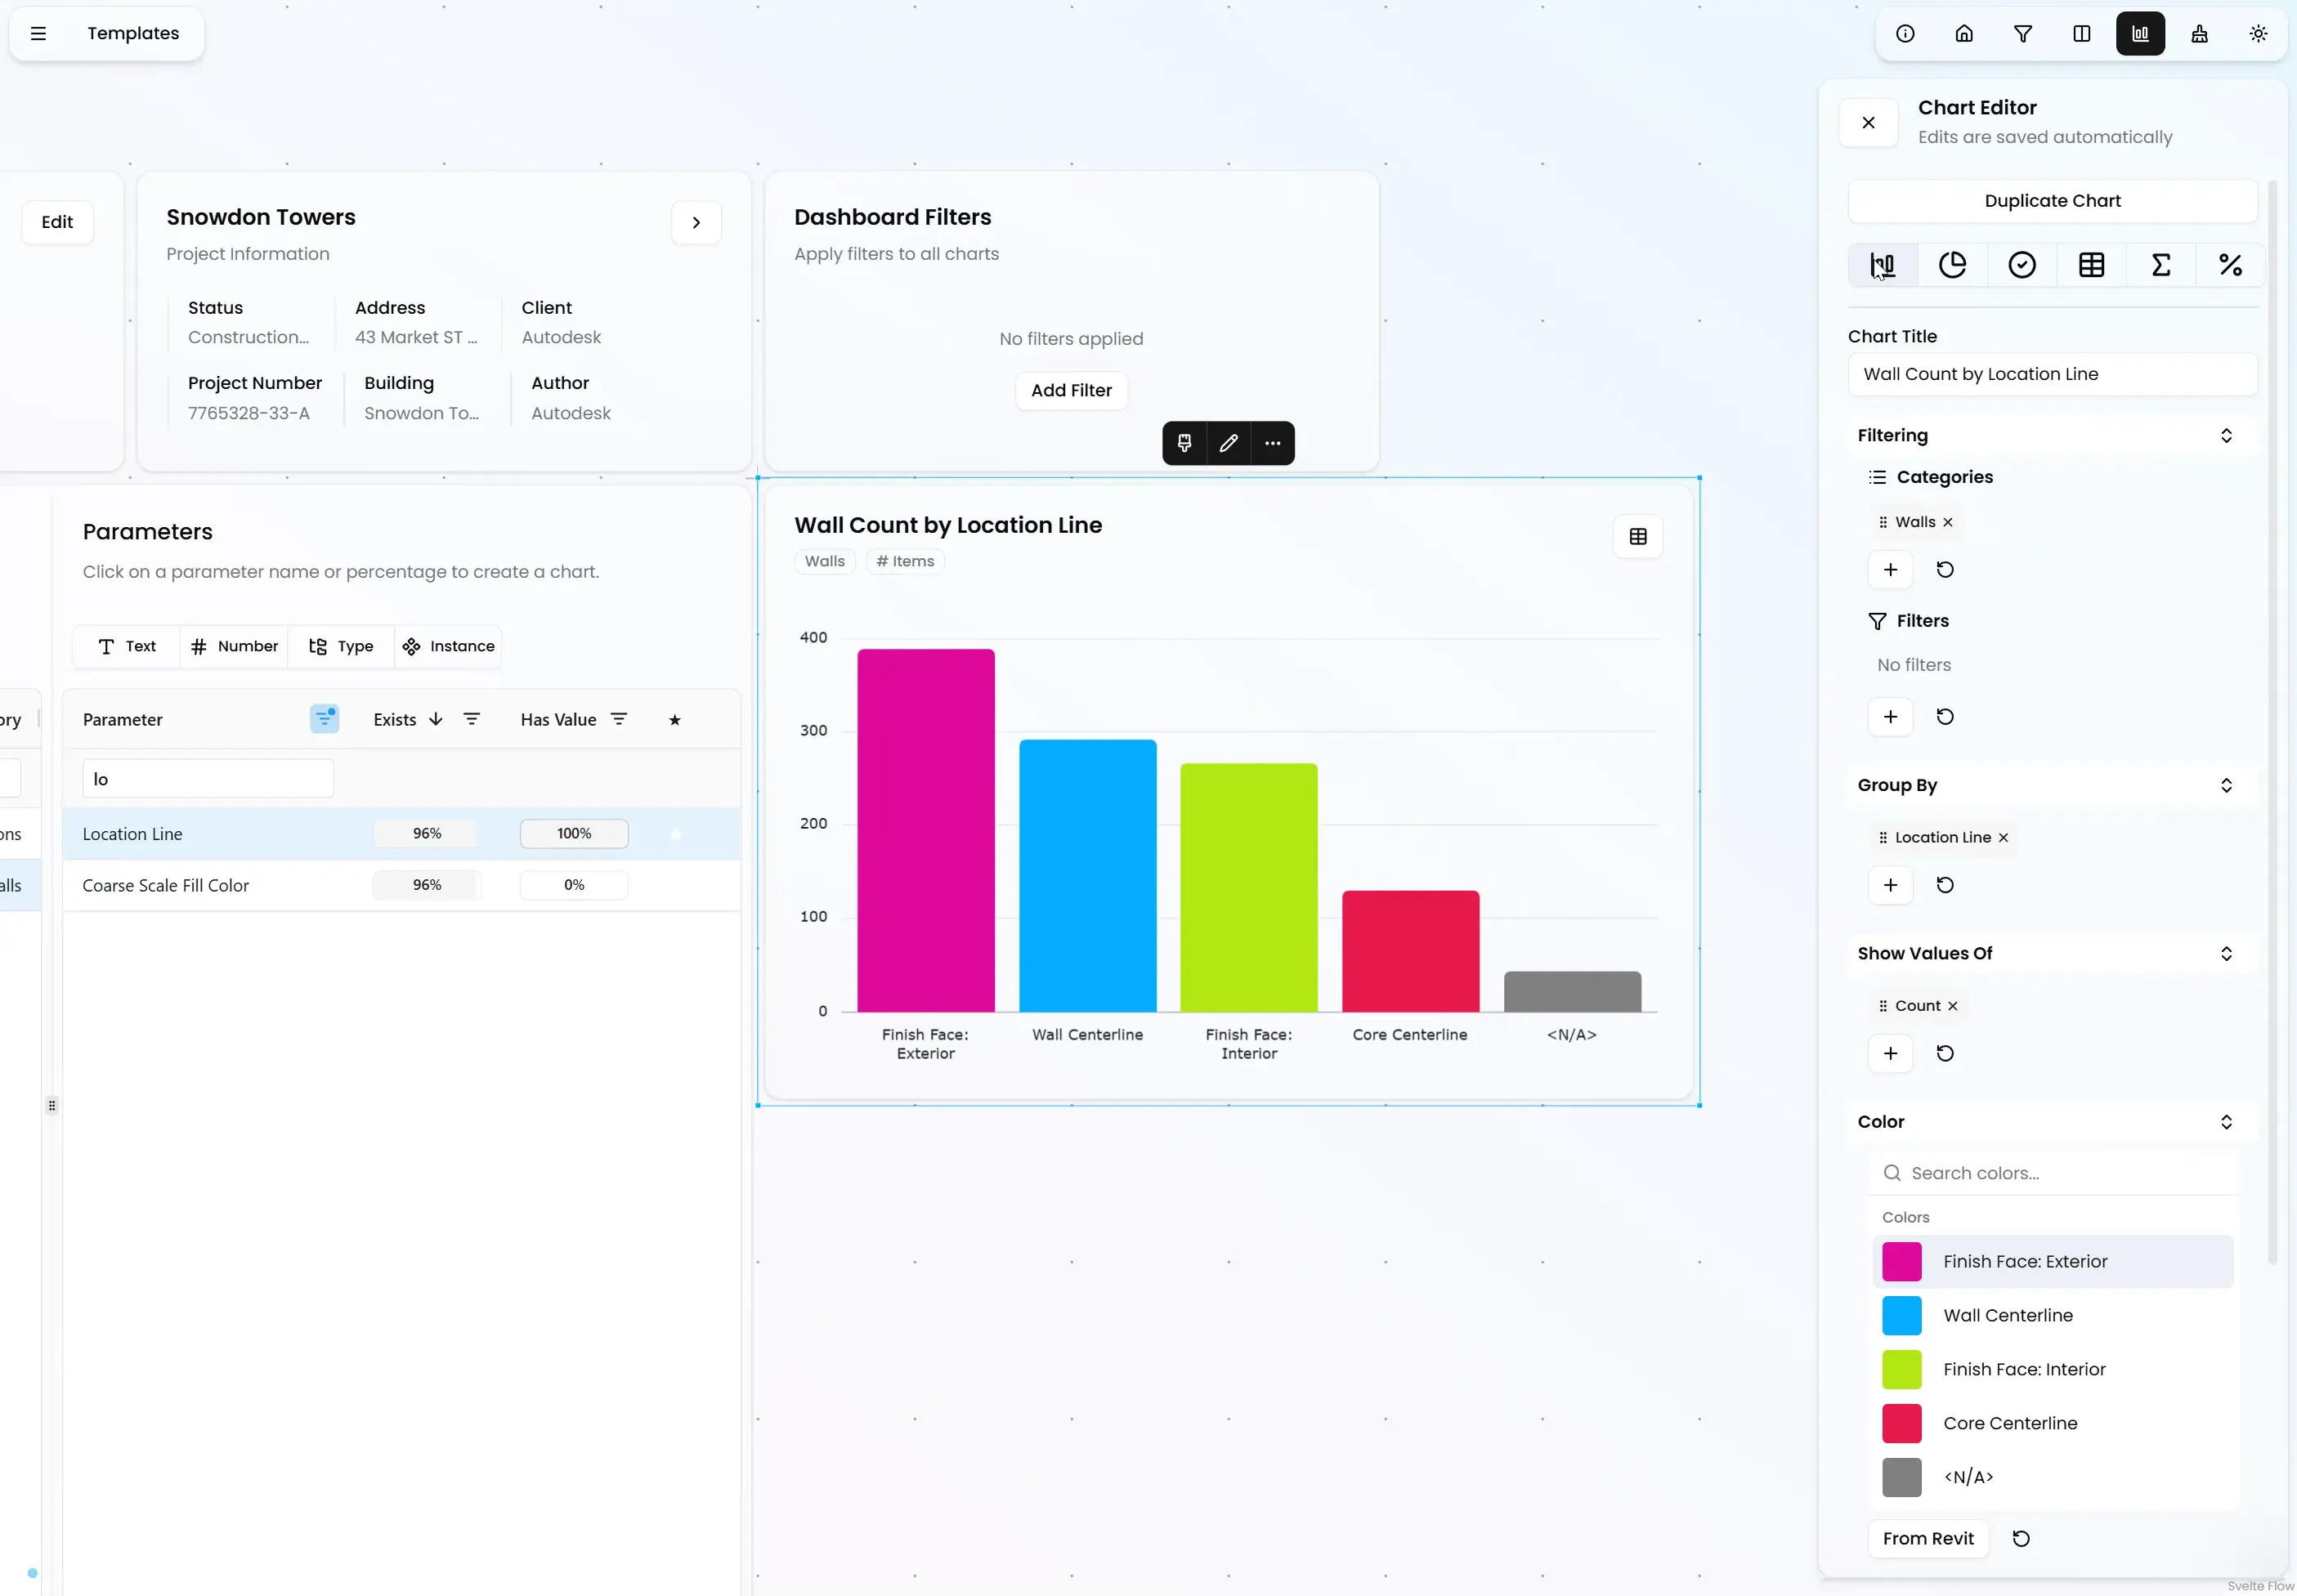
Bar & Donut
Bar or Donut charts are great for getting a quick overview of your data.
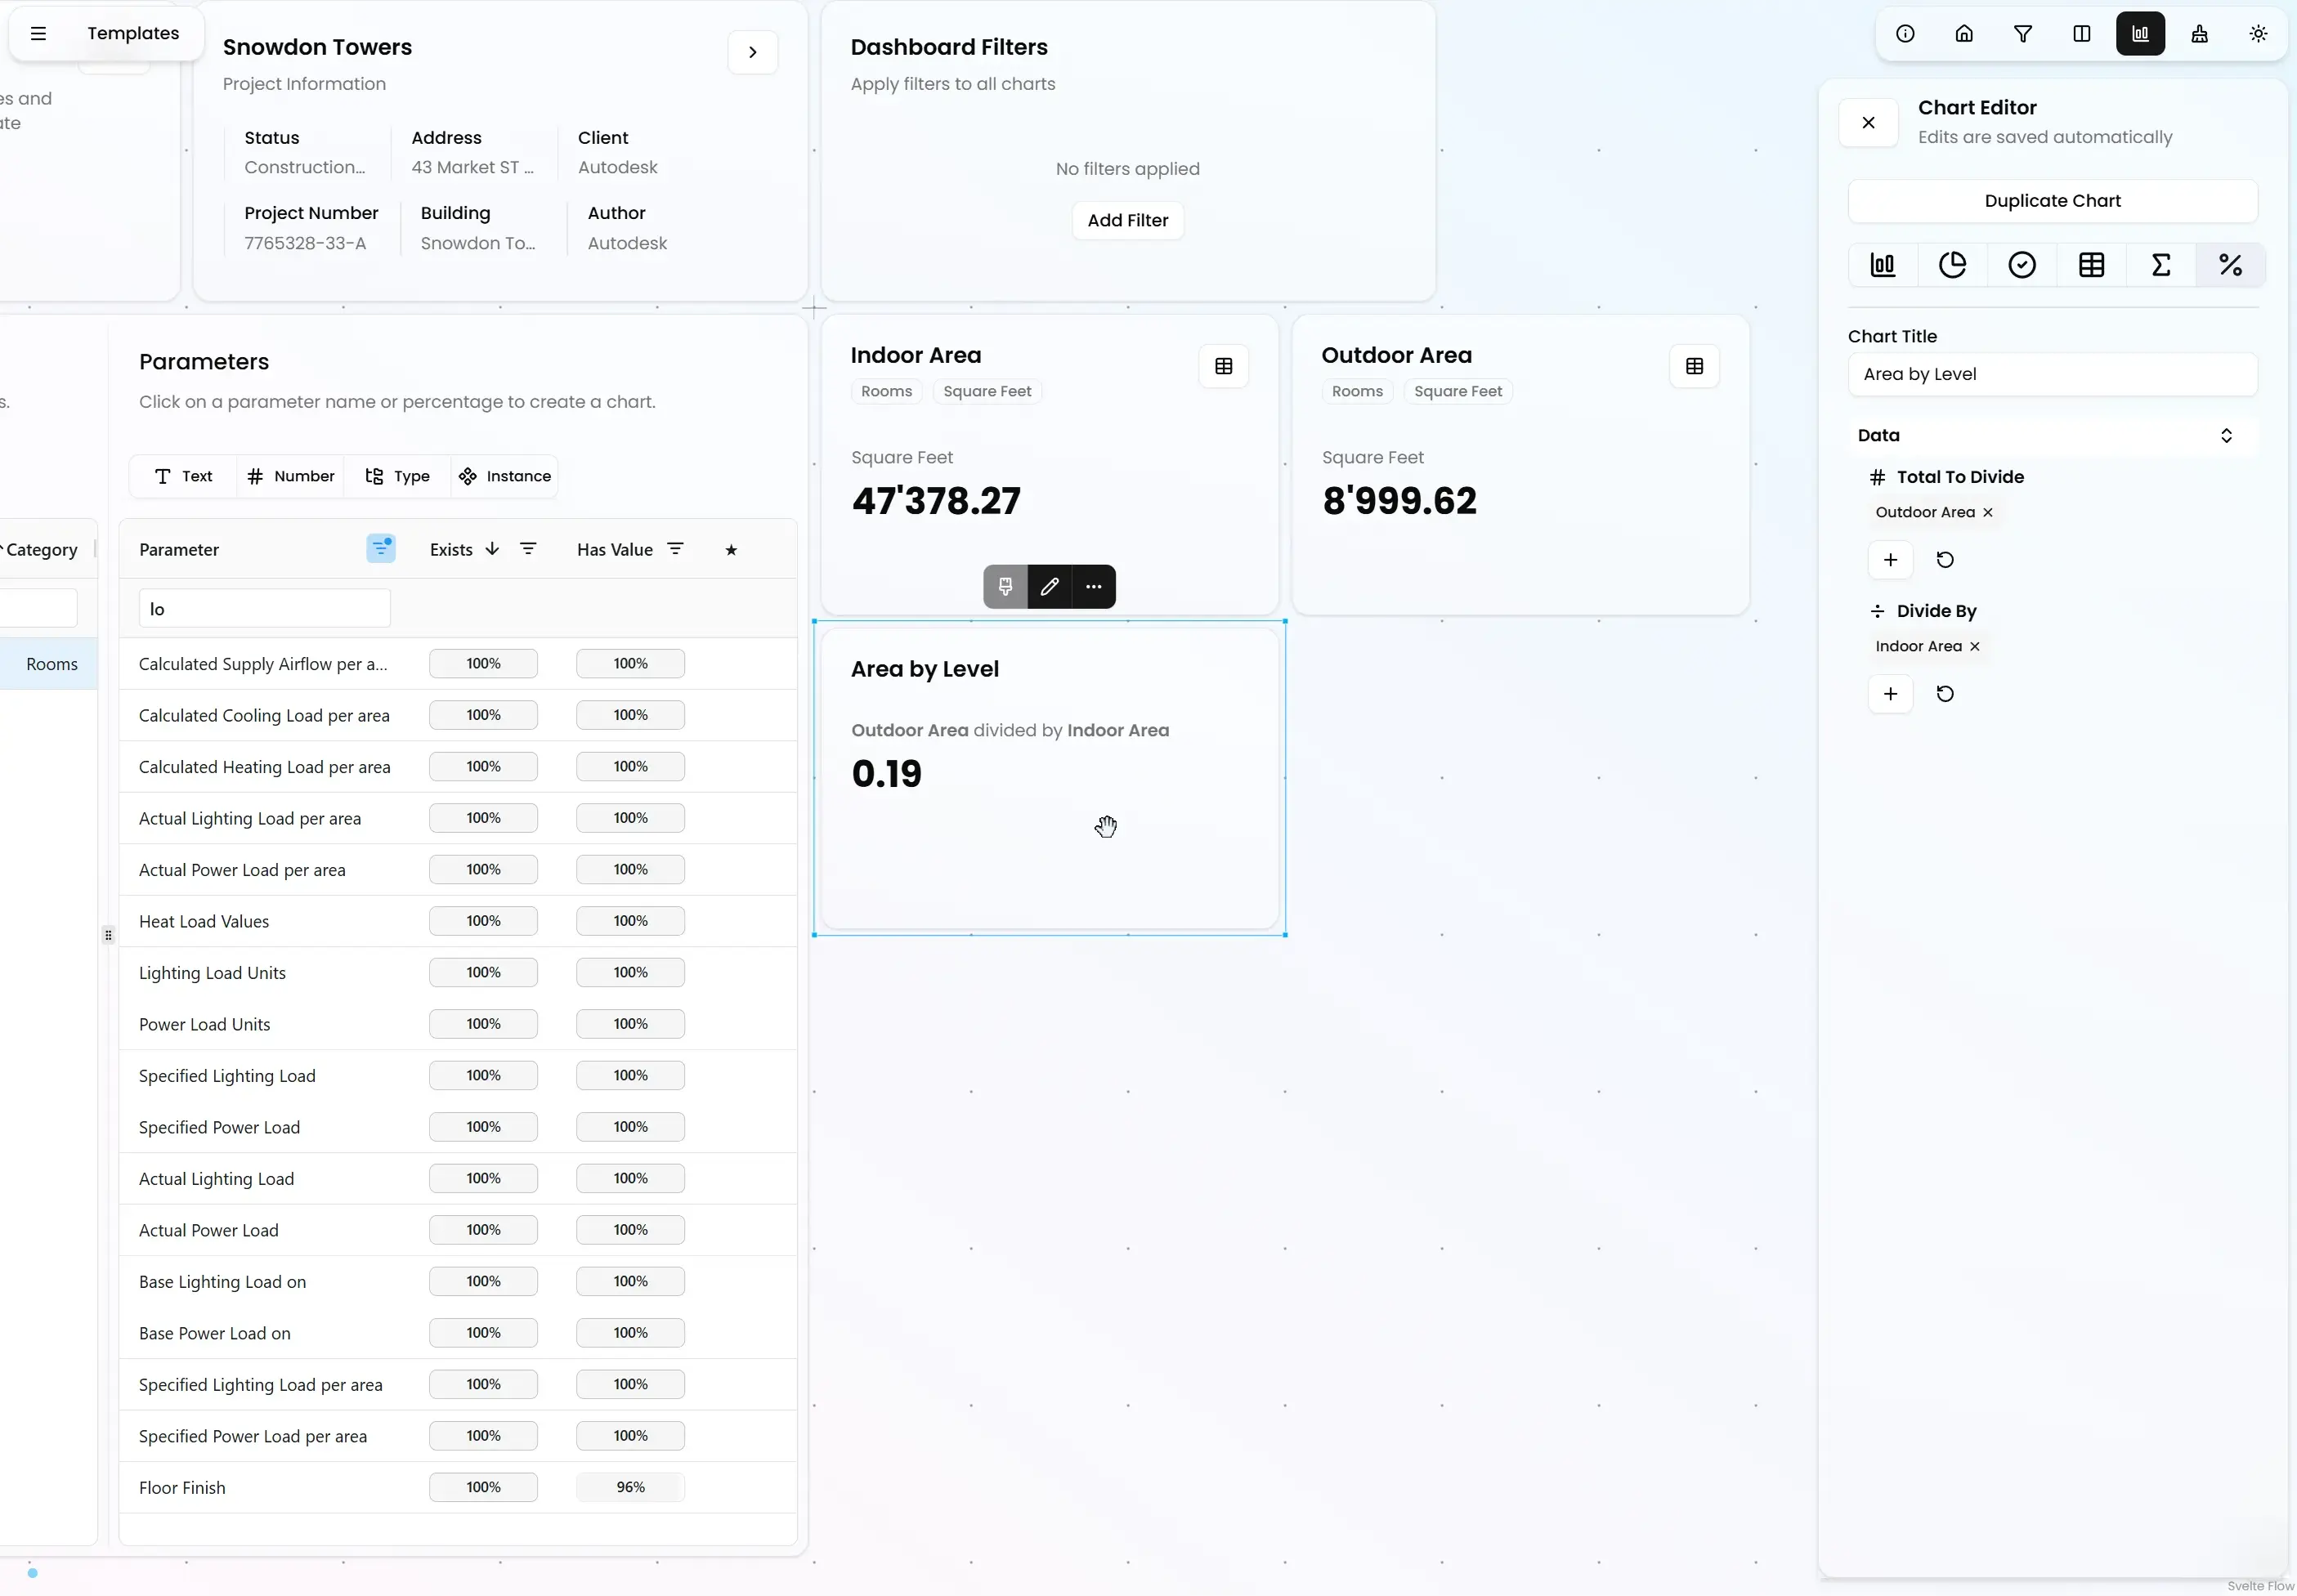
Totals & Ratios
Calculate ratios that are always up to date. Based on totals you define. Speed up target value design by avoiding exporting Revit to Excel.
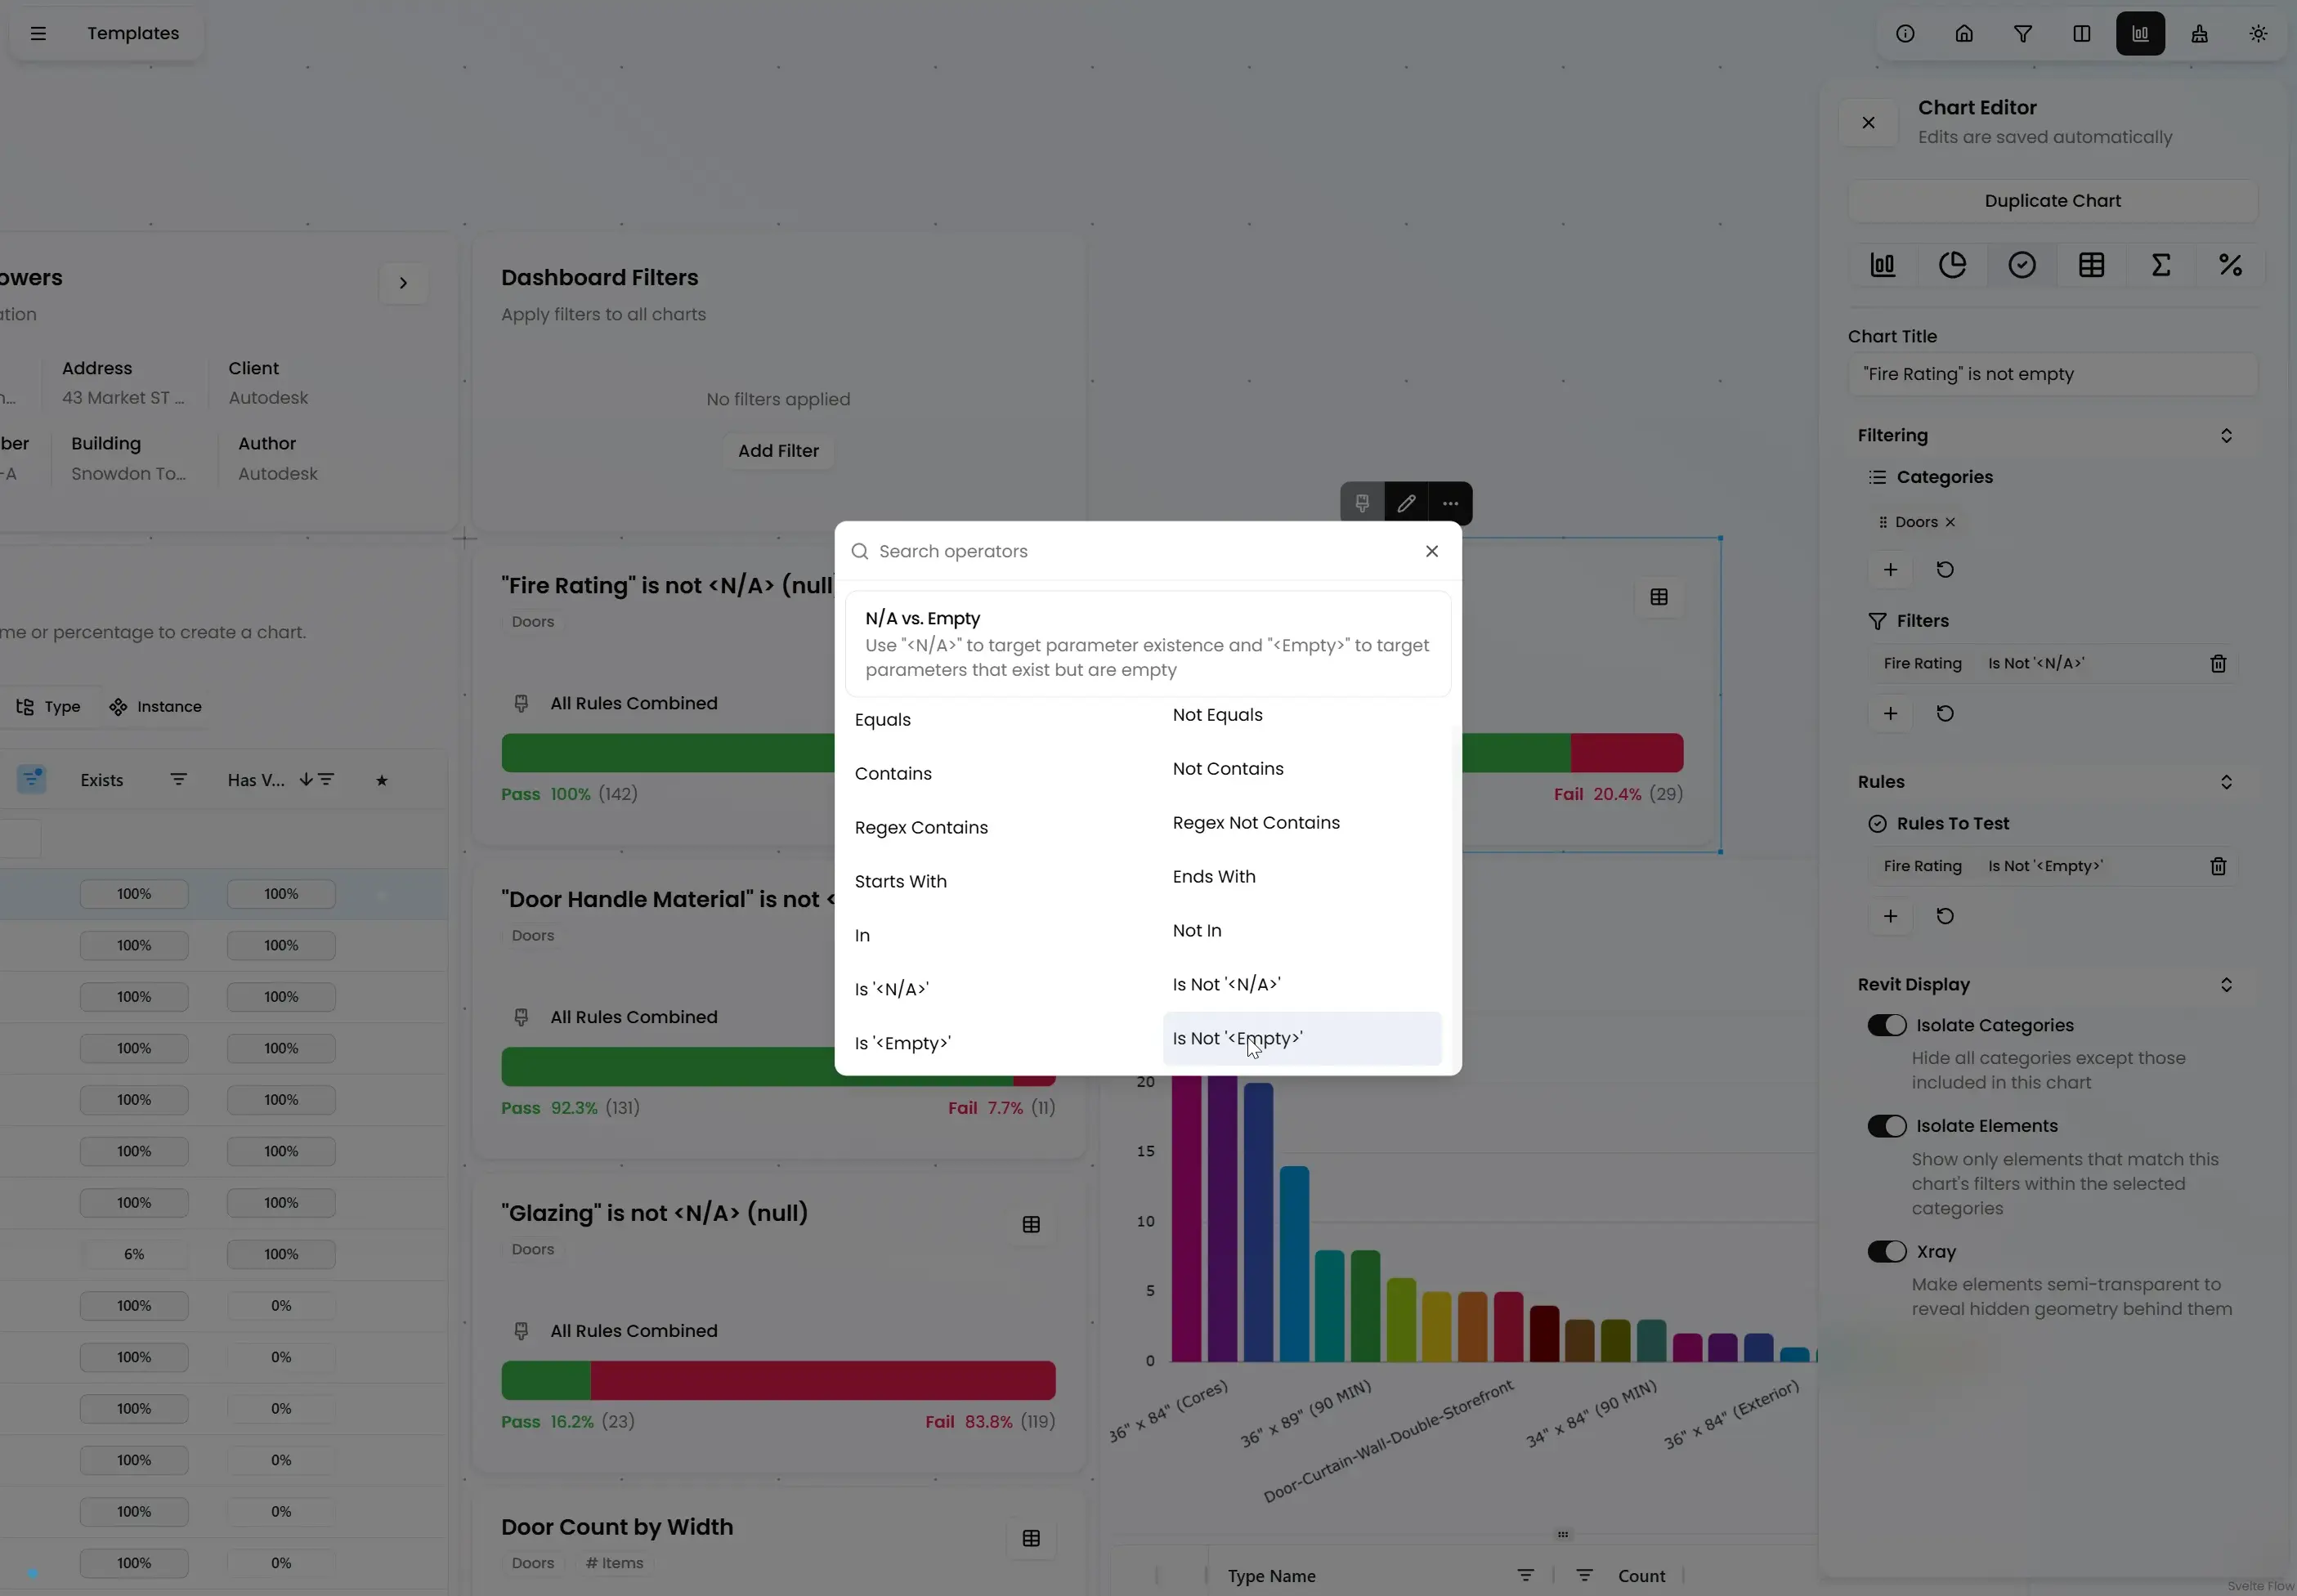
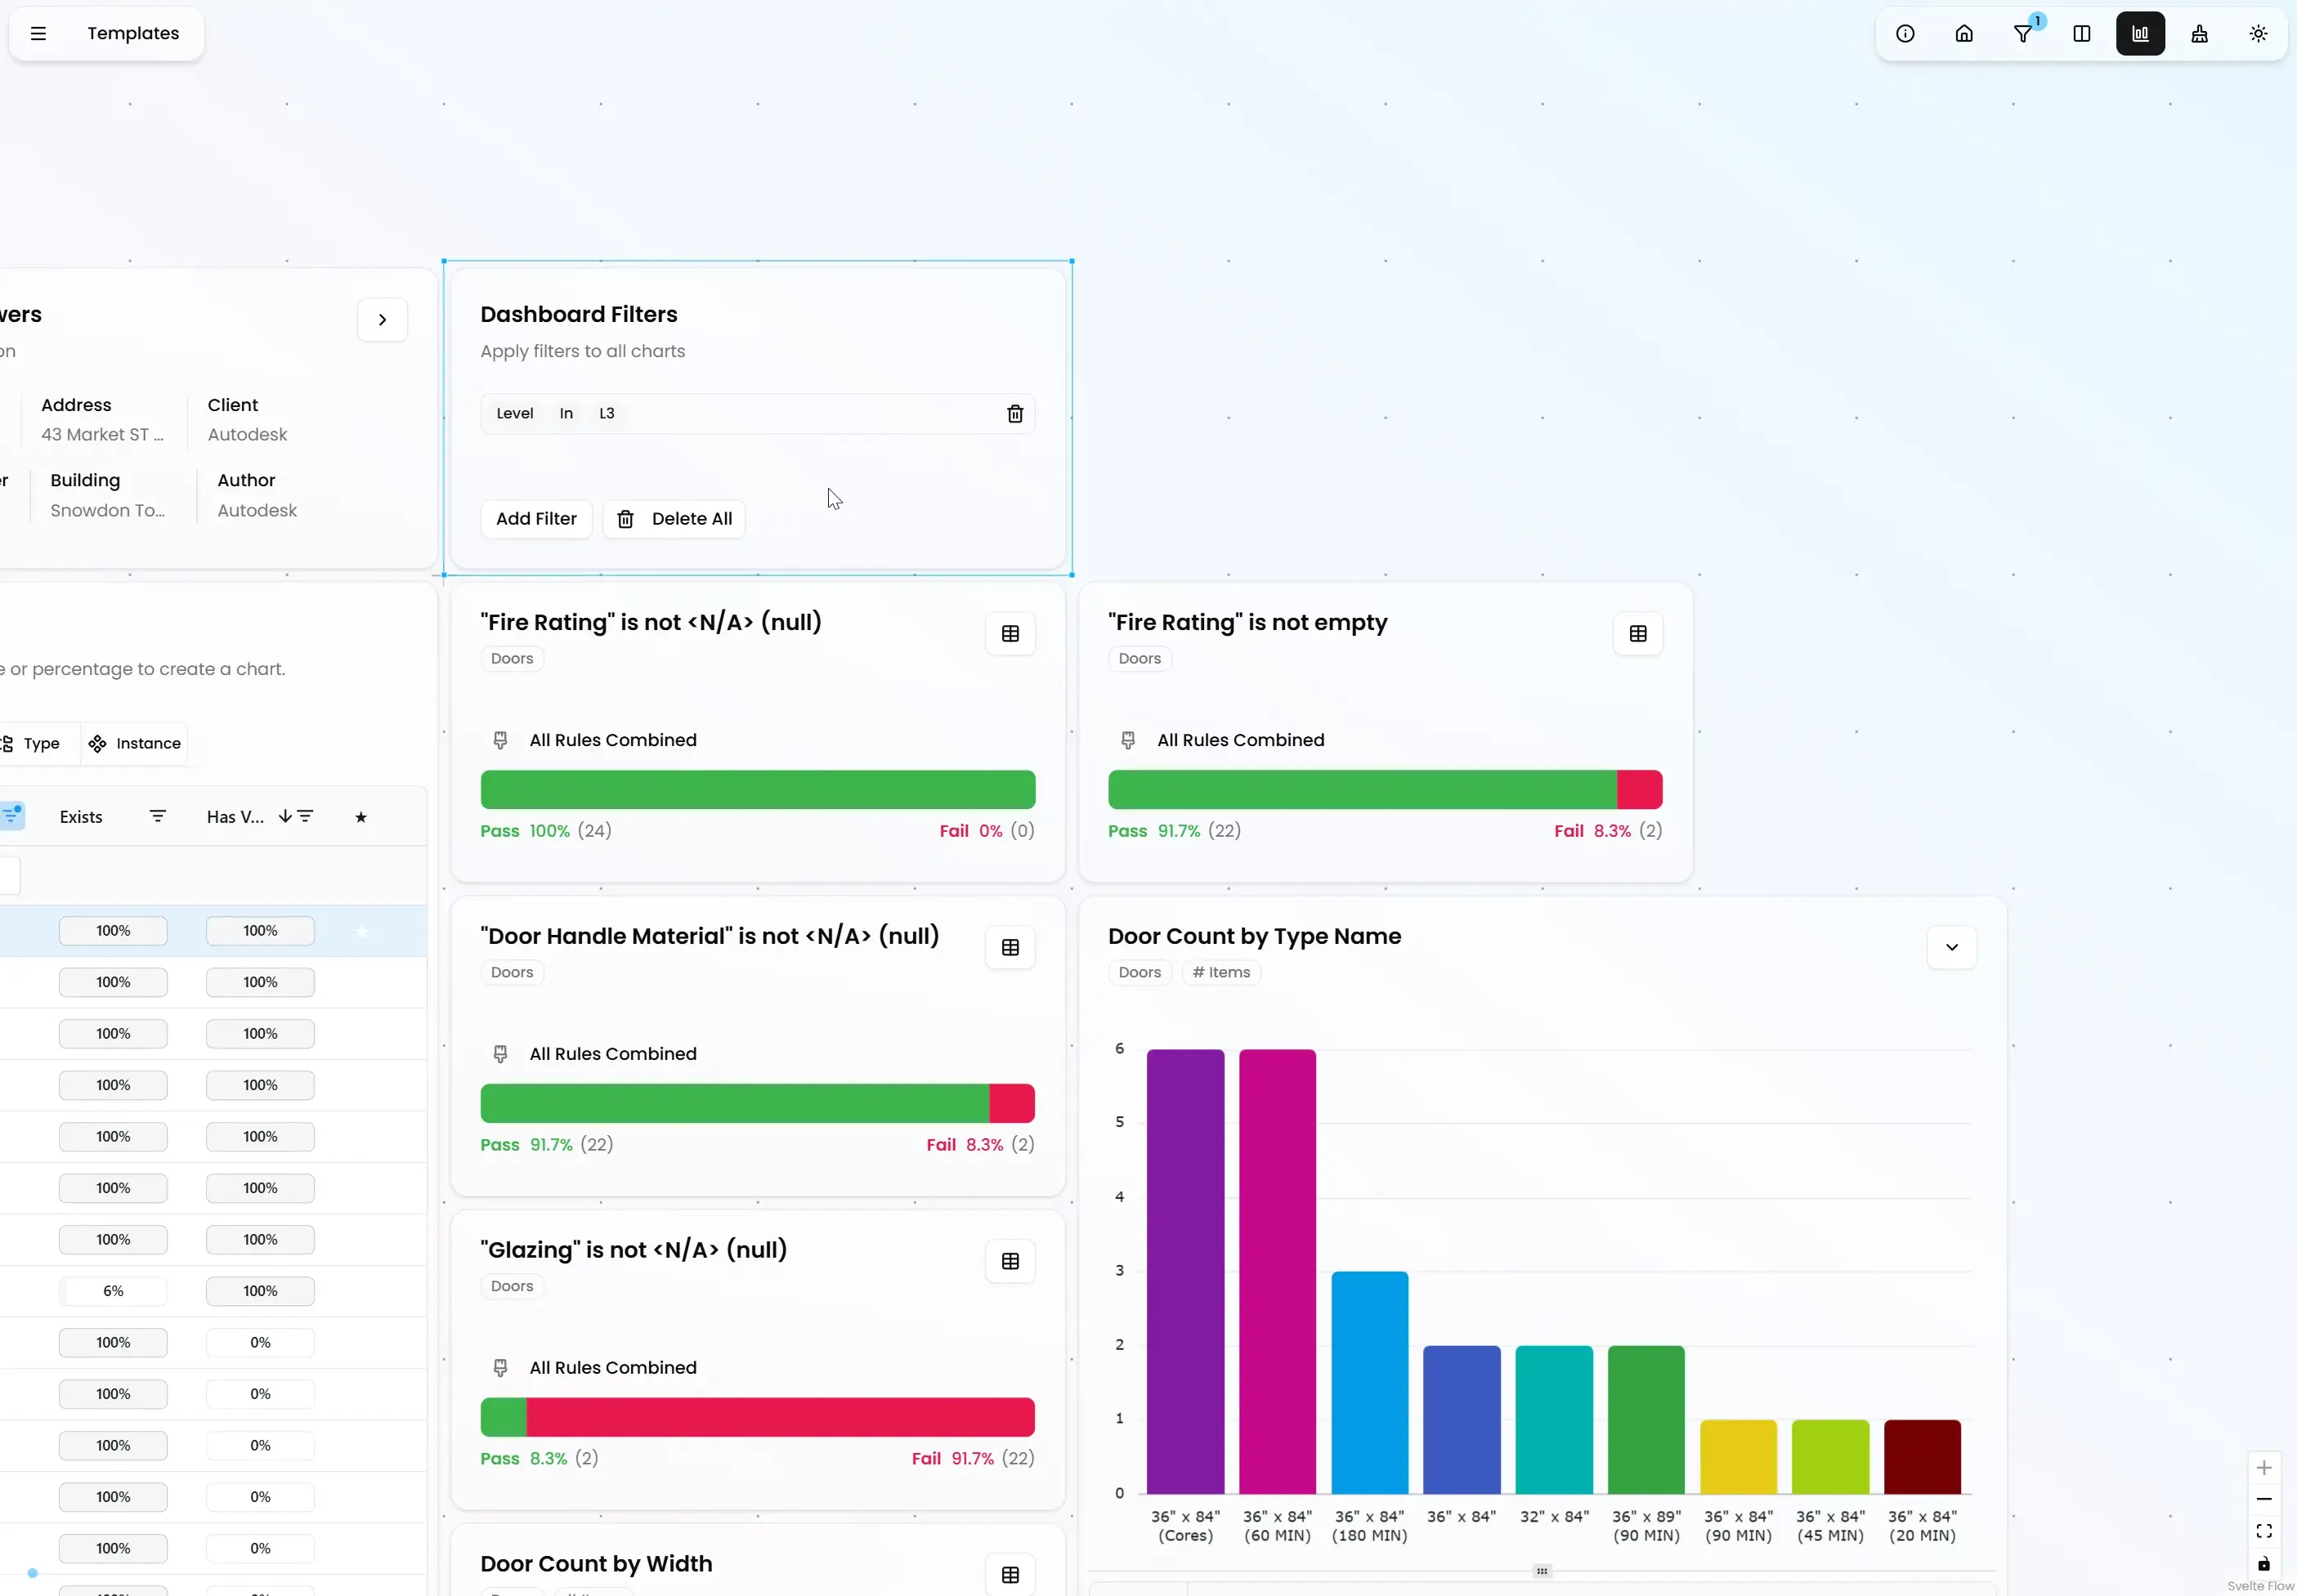
Rules
Use the Rule Chart to define and test data requirements. This is Revit quality control in real-time.
Focus on what's most important.
Narrow down issues with dashboard-wide filters.
Value suggestions help you create precise filters without guessing.
Filter by category, level, or any of your parameters to quickly get to the point.
Get suggestions for values when creating filters.
No more guessing what the exact spelling is.