One of the most powerful features in Vyssuals is the ability to analyze material usage and quantities in your Revit models. This month, we've added comprehensive material tracking capabilities that go beyond simple material definitions to capture how materials are actually used throughout your building elements.
What Are Material Usages?
In Revit, we need to distinguish between material definitions and material usages. A material usage is any time a material is applied to an element—whether it's a wall layer, door frame, or window glass.
Vyssuals can now track these material usages, giving you insights into:
- Material quantities across your entire model
- Layer-by-layer analysis for compound structures
- Family material tracking for doors, windows, and other loadable families
Enabling Material Usage Tracking
Before you can analyze materials in Vyssuals, you need to enable the feature in your Revit connector settings:
- Open the Vyssuals connector in Revit (look for the cogwheel icon)
- Check the box for "Include Material Usages"
- Note: This option will slow down processing slightly as it collects additional material data
The connector will now gather comprehensive material information as it processes your model, including all the materials used in wall layers, floor assemblies, and family components.
Creating Material-Based Charts
Once material usage tracking is enabled, you can create powerful material analysis charts:
Step 1: Set Up Your Chart
- Clear default charts to start fresh
- Add a new chart to your dashboard
- Set categories to focus on specific element types (e.g., "Walls")
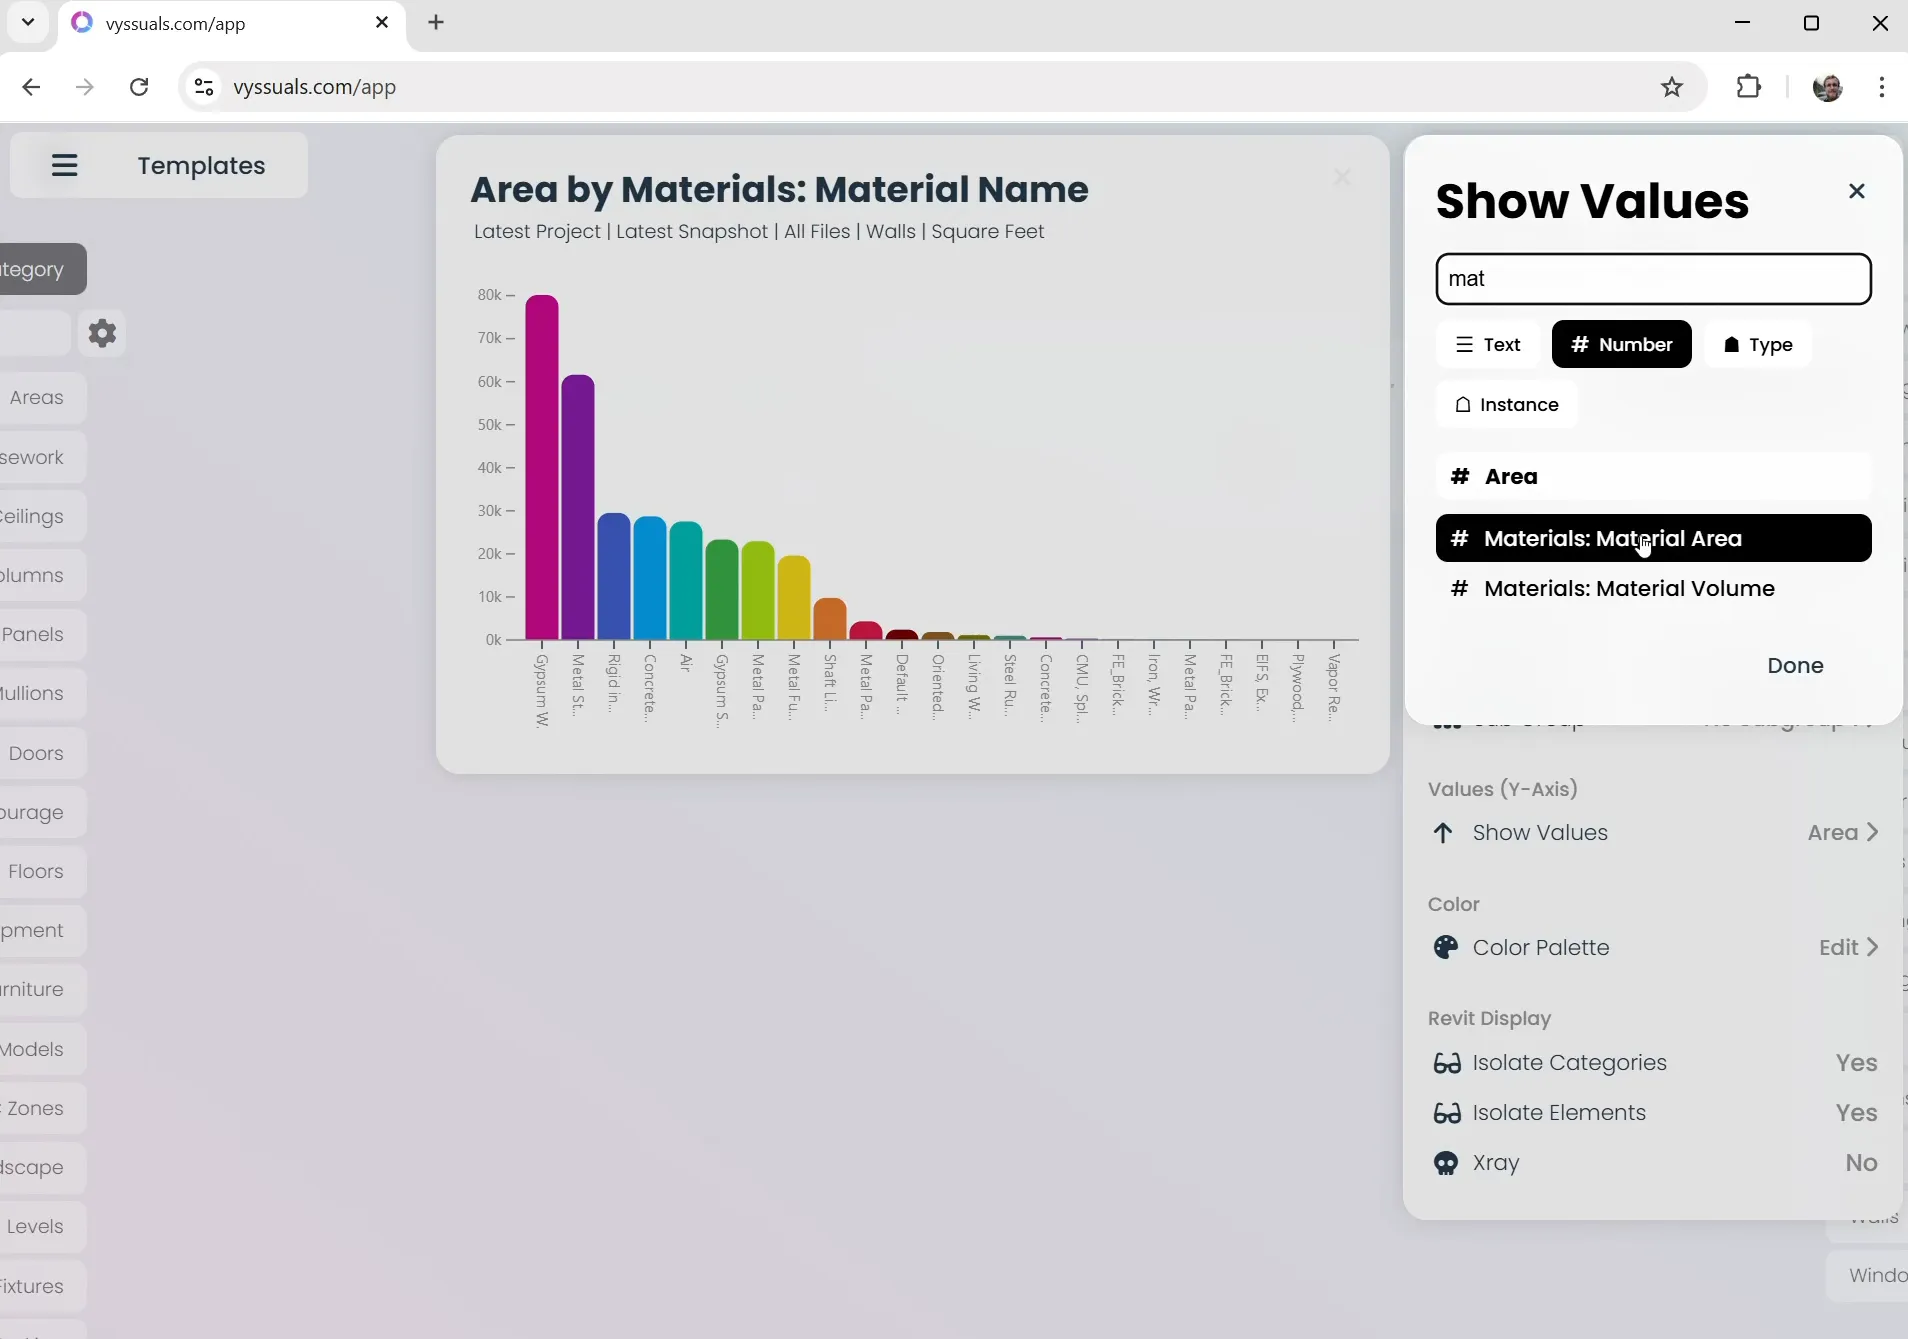
Step 2: Group by Material
- In the "Group By" section, search for "material"
- Select "Materials: Material Name" to group elements by their materials
- Choose your values - you'll see options for:
- Materials: Material Area - Shows the area of each material layer
- Materials: Material Volume - Shows the volume of each material layer
Step 3: Compare Area vs Volume
For walls and floors, you might want to see both area and volume:
- Duplicate your chart to create a side-by-side comparison
- Use area for the first chart (shows material coverage)
- Use volume for the second chart (shows material quantities)
Understanding Material Properties
Material Area vs Volume
- Material Area: Represents the surface area of each material layer within an element
- Material Volume: Represents the actual volume of material used
For walls and floors, area is often more useful as it shows material coverage. For families like doors and windows, volume might be more relevant depending on how Revit calculates the geometry.
Material Property Naming
In the Vyssuals interface, material properties are clearly labeled:
- Materials: Material Name - The actual material definition
- Materials: Material Area - Area per material layer
- Materials: Material Volume - Volume per material layer
Why You Can't Colorize by Materials
This is a common question: "Why can't I colorize my 3D model by materials?"
The answer lies in how Revit structures material data. A single wall can have multiple materials in different layers:
- Concrete core
- Insulation
- Gypsum board
- Paint finish
If you tried to colorize by material, Vyssuals wouldn't know which color to assign to the wall. Should it be the color of the concrete, the insulation, or the gypsum board? This ambiguity makes material-based colorization impossible.
Instead, use the interactive charts to explore material relationships and drill down into specific elements.
Drilling Down into Material Data
Interactive Exploration
- Click on chart bars to select all elements with that material
- Use the context table to see detailed element information
- Filter further by level, type, or other parameters
Practical Example
Let's say you want to analyze gypsum wall board usage:
- Click on the gypsum wall board bar in your material chart
- See all walls containing this material in the context table
- Filter by level to focus on specific floors
- Select individual elements to examine them in Revit
Advanced Material Analysis
Family Material Tracking
Material usage tracking extends beyond system families to include:
- Doors and windows - Frame materials, glass types
- Columns and beams - Structural material properties
- Custom families - Any materials you've assigned
Compound Structure Analysis
For walls, floors, and roofs with multiple layers:
- Layer-by-layer breakdown of material quantities
- Thickness considerations when comparing area vs volume
- Assembly optimization insights
Technical Deep Dive: Data Architecture
Many-to-Many Relationships
Material usage data represents a classic many-to-many relationship:
- One element (wall, floor) can have multiple materials
- One material can be used in multiple elements
This is typically stored in a junction table in traditional OLTP (Online Transaction Processing) databases.
Vyssuals' OLAP Advantage
While Revit uses an OLTP structure optimized for frequent updates, Vyssuals employs an OLAP (Online Analytical Processing) database designed for:
- Fast analytical queries
- Complex aggregations
- Real-time chart rendering
This is why Vyssuals can process material data so quickly—the information is pre-processed and structured for analytical queries rather than transactional updates.
Best Practices for Material Analysis
1. Start with Specific Categories
Don't try to analyze all materials at once. Focus on:
- Walls first - They typically have the most complex material assemblies
- Floors and roofs - For understanding horizontal material distribution
- Families - For component-specific material tracking
2. Use Appropriate Metrics
- Area for surface materials (wall coverings, floor finishes)
- Volume for structural materials (concrete, steel)
- Count for discrete material instances
3. Leverage Filtering
- Filter by level to understand material distribution across floors
- Filter by type to compare similar elements
- Use cross-filtering to see relationships between materials and other properties
Common Use Cases
Quantity Takeoffs
- Material cost estimation based on actual usage
- Order planning for construction materials
- Sustainability analysis of material quantities
Design Validation
- Verify material specifications meet project requirements
- Check material consistency across similar elements
- Identify material conflicts or missing assignments
Troubleshooting Material Data
Missing Material Information
If you're not seeing material data:
- Check connector settings - Ensure "Include Material Usages" is enabled
- Verify material assignments - Elements must have materials assigned in Revit
Inconsistent Results
- Material definitions must be consistent across your model
- Family materials should be properly assigned
- System family materials need to be set in type properties
Conclusion
Material usage tracking in Vyssuals opens up a whole new dimension of BIM analysis. By understanding how materials are distributed throughout your model, you can make better design decisions, optimize material usage, and provide more accurate cost estimates.
The key is to start simple—enable material tracking, create basic material charts, and gradually explore more complex analyses. Remember that material data is inherently complex due to the many-to-many relationships between elements and materials, but Vyssuals makes this complexity manageable and insightful.
Ready to dive deeper into your material data? Enable material usage tracking in your next Vyssuals session and discover what insights are hiding in your Revit model's material properties.
This feature is available in Vyssuals Revit Connector 0.5.0 and later. For more information about the recent updates, check out our Major Update August 2025 blog post.