Design options are a powerful feature in Revit that allows you to explore multiple design alternatives within a single model. Vyssuals takes this capability to the next level by providing comprehensive analysis tools that help you compare design options, analyze their performance, and make data-driven decisions about which alternative best meets your project requirements.
Understanding Design Options in Vyssuals
Design options in Revit represent different design alternatives for the same project. These could be:
- Massing variations for different building forms
- Layout alternatives for floor plans
- Material and finish options for different design approaches
- Structural system variations for different construction methods
Vyssuals can analyze all these options simultaneously, giving you insights that would be impossible to gather manually.
Enabling Design Option Analysis
Step 1: Configure Your Connector Settings
Before you can analyze design options, you need to enable the feature in your Vyssuals Revit connector:
- Open the Vyssuals connector in Revit (look for the cogwheel icon)
- Go to settings and check "Include Design Options"
- Start Vyssuals to begin collecting data from all design options
Important: If you don't enable this setting, Vyssuals will only analyze the main model and the primary option of each design option set, missing valuable insights from alternative designs.
Step 2: Understanding the Data Structure
When design options are enabled, Vyssuals creates a hierarchical structure:
- Option Set Name (e.g., "Massing Options")
- Option Name (e.g., "Cubic", "Shaped", "Stepped")
- Parameter Values for each option
The naming convention follows: Option Set::Option Name (with double colons as separators).
Creating Design Option Dashboards
Basic Design Option Analysis
Start by creating charts that show the full scope of your design options:
- Clear existing charts to start fresh
- Add a new chart to your dashboard
- Set categories to focus on specific element types (e.g., "Mass Floors")
- Group by design option to see all alternatives
- Use floor area as your primary metric
This gives you an immediate overview of how your different design options compare in terms of basic metrics like floor area.
Advanced Filtering for Specific Options
To focus on specific design options, use Vyssuals' advanced filtering capabilities. Navigate to Advanced Filters in your chart editor and search for the "Design Option" parameter. Set the filter type to "Contains" and enter your option name (e.g., "Cubic", "Shaped", "Stepped"). Apply the filter to restrict the chart to that specific option, allowing you to create focused charts for each design alternative that make comparisons easier and more meaningful.
Building Comprehensive Design Option Dashboards
Step-by-Step Dashboard Creation
1. Create Option-Specific Charts
For each design option, create dedicated charts:
- Floor Area by Level: Shows how each option distributes space across building levels
- Usage Distribution: Analyzes programmatic distribution (hotel, office, parking, etc.)
- Total Area Summary: Provides overall area comparisons between options
2. Organize Your Layout
Arrange your charts logically:
- Top row: Floor area by level for each option
- Middle row: Usage distribution for each option
- Bottom row: Total area summaries and ratios
3. Apply Consistent Filtering
Ensure each chart shows the correct design option by using advanced filters to isolate specific options. Verify your filter settings before finalizing charts to maintain data accuracy across your dashboard.
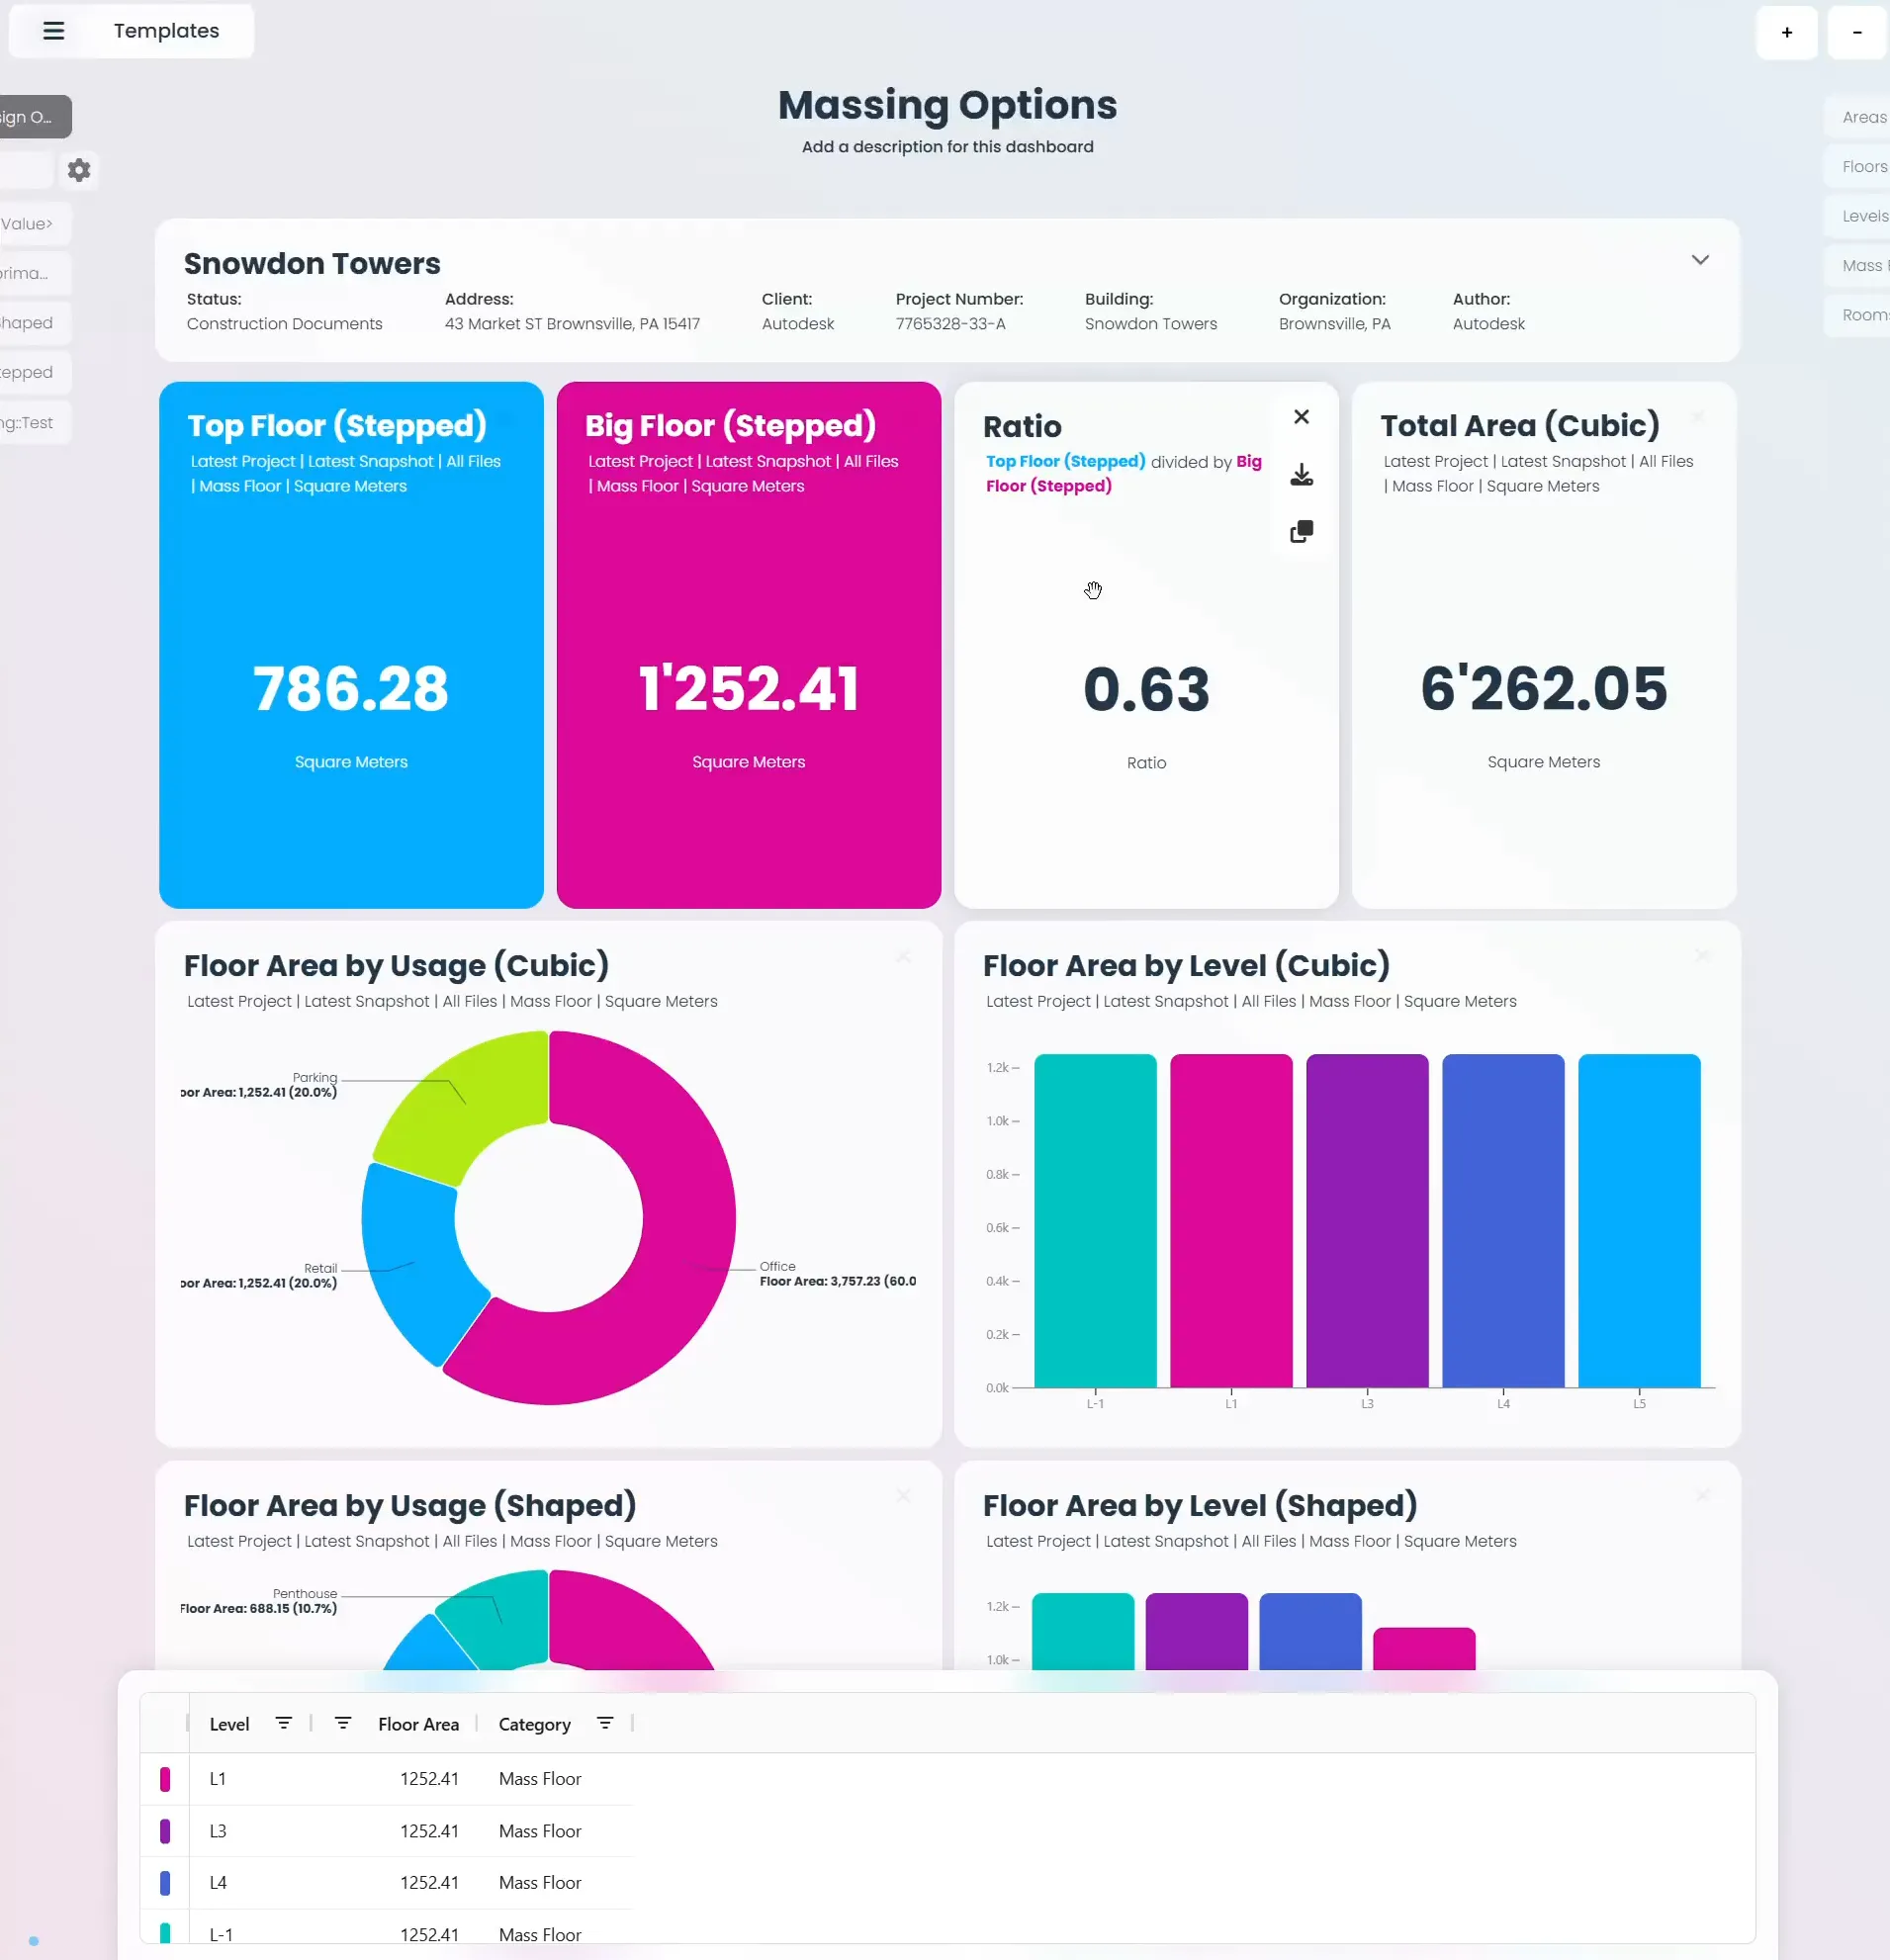
Example Dashboard Structure
A well-organized design options dashboard might include three main sections. The first row focuses on floor area analysis, with separate charts for each option (Cubic, Shaped, and Stepped) showing floor area by level. The second row displays usage distribution for each option, allowing you to compare how different alternatives allocate space for various functions. The third row provides summary and ratio information, including total area comparisons, floor-to-floor ratios, and overall option comparisons.
Advanced Analysis Techniques
Ratio Analysis Between Options
Vyssuals' ratio charts allow you to compare different aspects of your design options:
Creating Ratio Charts
- Add a ratio chart to your dashboard
- Configure two total charts as the basis for comparison
- Set specific filters for each total chart (e.g., different levels or options)
- Calculate ratios between different design aspects
Practical Applications
- Floor-to-floor ratios for setback compliance
- Area efficiency comparisons between options
- Program distribution ratios for different alternatives
Example: Building Code Compliance
Many building codes require upper floors to be smaller than lower floors for proper setbacks. Using ratio charts, you can:
- Calculate the ratio between upper and lower floor areas
- Verify compliance with code requirements (e.g., 0.75 ratio for setbacks)
- Adjust your design in real-time to meet requirements
- Document compliance for regulatory approval
Parameter-Specific Analysis
Beyond basic area metrics, you can analyze any parameter available in your Revit model:
Common Parameters to Analyze
- Usage classifications (hotel, office, parking, retail)
- Material quantities and costs
- Structural properties and load calculations
- Environmental factors like solar exposure or wind loads
- Cost estimates and budget comparisons
Creating Parameter-Specific Charts
- Identify the parameter you want to analyze
- Create a new chart or duplicate an existing one
- Set the category to focus on relevant elements
- Apply design option filters to isolate specific alternatives
- Configure the chart type (bar, donut, total, etc.) for best visualization
Real-Time Design Iteration
Live Dashboard Updates
One of Vyssuals' most powerful features is real-time synchronization with Revit. Changes in Revit immediately update your dashboard, design iterations are reflected instantly in your analysis, parameter adjustments update all related charts automatically, and option switching shows different data sets in real-time.
Iterative Design Process
Use this live connection to optimize your design options:
- Make changes in Revit (adjust massing, modify floor areas, change usage)
- Observe updates in your Vyssuals dashboard
- Analyze the impact on your key metrics
- Iterate further based on the insights
- Refine until you achieve your target values
Example: Optimizing for Code Compliance
If you need a 0.75 ratio for building setbacks:
- Start with your initial design and check the ratio in Vyssuals
- Adjust the massing in Revit to modify floor areas
- Watch the ratio update in real-time
- Continue adjusting until you reach 0.75
- Document the final design that meets requirements
Saving and Reusing Your Dashboards
Creating Templates
Once you've built a comprehensive design options dashboard, you can save it as a template for future use. Navigate to the Templates section in Vyssuals, select "Personal" templates (available with licensed accounts), click "Save New" to save your current dashboard, give it a descriptive name like "Massing Options Analysis," and add a description explaining the dashboard's purpose.
Reusing Saved Dashboards
When you need to analyze design options in other projects:
- Clear your current dashboard or start a new session
- Go to Templates and select your saved dashboard
- Load the template to restore your chart configuration
- Apply appropriate filters for the new project
- Customize as needed for project-specific requirements
Best Practices for Design Option Analysis
1. Start with Clear Objectives
Before building your dashboard, define what you want to achieve:
- What decisions do you need to make?
- Which metrics are most important for your project?
- How will you compare different alternatives?
2. Use Consistent Naming Conventions
- Design option names should be clear and descriptive
- Chart titles should indicate the option and metric being shown
3. Focus on Key Metrics
Don't try to analyze everything at once:
- Start with 2-3 key metrics that drive your decisions
- Add complexity gradually as you become comfortable
- Eliminate charts that don't contribute to decision-making
Common Challenges and Solutions
Missing Design Option Data
Problem: Some design options don't appear in your dashboard.
Solution: Verify "Include Design Options" is enabled in connector settings and check that design options are properly configured in Revit.
Complex Filtering Issues
Problem: Advanced filters aren't working as expected.
Solution: Use "Contains" filters for text-based parameters, verify filter syntax and case sensitivity, and test filters with simple conditions before adding complexity.
Conclusion
Working with design options in Vyssuals transforms how you approach design decisions. Instead of manually comparing alternatives or relying on static reports, you get real-time insights into how different options perform, comprehensive analysis across multiple parameters and metrics, interactive dashboards that update as you iterate, and data-driven decision making for better project outcomes.
The key is to start simple and build complexity gradually. Begin with basic area comparisons, add usage analysis, and then incorporate advanced features like ratio charts and real-time iteration. As you become comfortable with the tools, you'll discover new ways to analyze and optimize your design options.
Remember that the goal isn't just to create beautiful dashboards—it's to make better design decisions. Use Vyssuals' design option analysis to understand the implications of your choices, communicate options to stakeholders, and ultimately deliver better buildings that meet your project requirements.
Ready to start analyzing your design options? Enable design option tracking in your Vyssuals connector and discover what insights are waiting in your Revit model's alternative designs.
This feature is available in Vyssuals Revit Connector 0.5.0 and later. For more information about the recent updates, check out our Major Update August 2025 blog post.